UNITED STATES SECURITIES AND EXCHANGE COMMISSION
Washington, DC 20549
FORM 10-K/A-2
|
x |
ANNUAL REPORT PURSUANT TO SECTION 13 OR 15(d) OF THE SECURITIES EXCHANGE ACT OF 1934 |
For the fiscal year ended March 31, 2007
|
o |
TRANSITION REPORT PURSUANT TO SECTION 13 OR 15(d) OF THE SECURITIES EXCHANGE ACT OF 1934 |
For the Transition Period From ________ to _________
Commission File Number 001-33034
BMB MUNAI, INC.
(Exact name of registrant as specified in its charter)
|
Nevada |
|
30-0233726 |
|
(State or other jurisdiction of |
|
(I.R.S. Employer |
|
incorporation or organization) |
|
Identification No.) |
|
|
|
|
|
202 Dostyk Ave, 4th Floor |
|
|
|
Almaty, Kazakhstan |
|
050051 |
|
(Address of principal executive offices) |
|
(Zip Code) |
+7 (3272) 375-125
(Registrant’s telephone number, including area code)
Securities registered under Section 12(b) of the Exchange Act:
|
Title of Each Class |
|
Name of Exchange on Which Registered |
|
|
|
|
|
Common - $0.001 |
|
American Stock Exchange |
Indicate by check mark if the registrant is a well-known seasoned issuer, as defined in Rule 405 of the Securities Act.
|
|
o Yes x No |
Indicate by check mark if the registrant is not required to file reports pursuant to Section 13 or Section 15(d) of the Exchange Act from their obligations under those Sections.
|
|
o Yes x No |
Indicate by check mark whether the registrant: (1) has filed all reports required to be filed by Section 13 or 15(d) of the Securities Exchange Act of 1934 during the preceding 12 months (or for such shorter period that the registrant was required to file such reports), and (2) has been subject to such filing requirements for the past 90 days.
|
|
x Yes o No |
Indicate by check mark if disclosure of delinquent filers pursuant to Item 405 of Regulation S-K is not contained herein, and will not be contained, to the best of registrant’s knowledge, in definitive proxy or information statements incorporated by reference in Part III of this Form 10-K or any amendment to this Form 10-K. o
|
Indicate by check mark whether the registrant is a large accelerated filed, an accelerated filer, or non-accelerated filer. |
Large accelerated Filer o Accelerated Filer x Non-accelerated Filer o
|
Indicate by check mark whether the registrant is a shell company (as defined in Rule 12b-2 of the Exchange Act.) |
|
|
o Yes x No |
As of September 30, 2006 the aggregate market value of the common voting stock held by non-affiliates of the issuer based upon the closing stock price of $5.15 per share was approximately $193,199,345.
As of June 7, 2007, the registrant had 44,690,657 shares of common stock, par value $0.001, issued and outstanding.
DOCUMENTS INCORPORATED BY REFERENCE: None
|
|
PART I |
Page |
|
|
|
|
|
|
EXPLANATORY NOTE |
3 |
|
|
|
|
|
Item 1. |
Business |
4 |
|
|
|
|
|
Item 1A. |
Risk Factors |
10 |
|
|
|
|
|
Item 1B. |
Unresolved Staff Comments |
16 |
|
|
|
|
|
Item 2. |
Properties |
17 |
|
|
|
|
|
Item 3. |
Legal Proceedings |
28 |
|
|
|
|
|
Item 4. |
Submission of Matters to a Vote of Security Holders |
28 |
|
|
|
|
|
|
PART II |
|
|
|
|
|
|
Item 5. |
Market for Registrant’s Common Equity, Related Stockholders Matters and |
|
|
|
Issuer Purchases of Equity Securities |
29 |
|
|
|
|
|
Item 6. |
Selected Financial Data |
32 |
|
|
|
|
|
Item 7. |
Management’s Discussion and Analysis of Financial Condition and |
|
|
|
Results of Operations |
33 |
|
|
|
|
|
Item 7A. |
Quantitative and Qualitative Disclosures About Market Risk |
48 |
|
|
|
|
|
Item 8. |
Financial Statements and Supplementary Data |
49 |
|
|
|
|
|
Item 9. |
Changes in and Disagreements with Accountants on Accounting and |
|
|
|
Financial Disclosure |
49 |
|
|
|
|
|
Item 9A. |
Controls and Procedures |
50 |
|
|
|
|
|
Item 9B. |
Other Information |
53 |
|
|
|
|
|
|
PART III |
|
|
|
|
|
|
Item 10. |
Directors, Executive Officers and Corporate Governance |
53 |
|
|
|
|
|
Item 11. |
Executive Compensation |
58 |
|
|
|
|
|
Item 12. |
Security Ownership of Certain Beneficial Owners and Management |
|
|
|
and Related Stockholder Matters |
66 |
|
|
|
|
|
Item 13. |
Certain Relationships and Related Transactions, and Director Independence |
68 |
|
|
|
|
|
Item 14. |
Principal Accounting Fees and Services |
68 |
|
|
|
|
|
Item 15. |
Exhibits, Financial Statement Schedules |
69 |
|
|
|
|
|
|
PART IV |
|
|
|
|
|
|
|
SIGNATURES |
70 |
2
Explanatory Note to Amendment No. 2 to Annual Report on Form 10-K
BMB Munai, Inc. (the “Company”) is filing this Amendment No. 2 on Form 10-K/A-2 (the “Second Amendment”) to its Annual Report for the fiscal year ended March 31, 2007, which was filed with the Securities and Exchange Commission (“SEC”) on June 14, 2007 (the “Original Annual Report”) and subsequently amended on July 10, 2007 (the “First Amendment”) in response to certain comments raised by the staff of the SEC.
Item 1 “Business” of the Original Annual Report is hereby amended to provide additional information to our table disclosing proved developed and proved undeveloped reserve volumes that we have scheduled to recover before and after the expiration of our current exploration license.
Item 2 “Properties” of the Original Annual Report is hereby amended to clarify the reasons for the discrepancies between the amount of expenditures reflected in the table on page 20 of the Original Annual Report and the amounts disclosed in the “Capitalized Costs” and “Exploration, Development and Acquisition Capital Expenditures” tables included in Item 2 and in Note 21 “SUPPLEMENTARY FINANCIAL INFORMATION ON OIL AND NATURAL GAS EXPLORATION DEVELOPMENT AND PRODUCTION ACTIVITIES (unaudited)” of the Notes to the Consolidated Financial Statements. Item 2 is also hereby amended to revising the “Drilling Operations”table on page 22 to disclose our drilling activity on a year-by-year basis rather than cumulatively.
Disclosure regarding fluctuations in “Other Income” inItem 7 “Management’s Discussion and Analysis of Financial Condition and Results of Operations” of the Original Annual Report is hereby amended to reflect certain reclassifications that were made in the financial statements for the year ended March 31, 2006 to conform to the March 31, 2007 presentation. The reclassifications had no effect on net income.
As noted in the preceding paragraph, Item 8 “Financial Statements and Supplementary Data” is hereby amended to include changes to Note 21 of the Notes to the Consolidated Financial Statements, including a change to the “Costs Incurred” table included in Note 21. In the Original Annual Report we presented “Costs Incurred” on a cumulative basis. In this Second Amendment the table has been revised to present “Costs Incurred” on a yearly basis consistent with Financial Accounting Standard 69. As a result of this change, “Total Costs Incurred” during the years ended March 31, 2006 and 2005 decreased from $107,591,043 and $68,079,938, respectively to $39,511,105 and $18,678,228, respectively. Other footnote disclosures were also revised in response to the SEC comments.
In accordance with Rule 12b-15 under the Securities Exchange Act of 1934, this Second Amendment also includes currently dated certifications from the Company’s Chief Executive Officer and Chief Financial Officer as required by Sections 302 and 906 of the Sarbanes-Oxley Act of 2002. The certification exhibits and Item 15 have been revised accordingly. Item 15 has also been revised to include the consents of Hansen, Barnett & Maxwell, P.C. and BDO Kazakhstanaudit, LLP to the incorporation by reference of this Amended Annual Report in the Registration Statement of the Company on Form S-3, as amended, currently on file with the Securities and Exchange Commission.
This Second Amendment speaks only to the original filing dates of the Original Annual Report and the First Amendment, and except for those Items discussed in this explanatory note, is unchanged from the Original Annual Report, as amended by the First Amendment. This Second Amendment does not reflect events after the filing of the Original Annual Report or modify or update those disclosures affected by subsequent events. Therefore, you should read this Second Amendment together with the other reports of the Company that update and supersede the information contained in this Second Amendment.
3
BMB MUNAI, INC.
Unless otherwise indicated by the context, references herein to the “Company”, “BMB”, “we”, our” or “us” means BMB Munai, Inc, a Nevada corporation, and its corporate subsidiaries and predecessors.
Forward Looking Information
Certain of the statements contained in all parts of this document including, but not limited to, those relating to our drilling plans, future expenses, changes in wells operated and reserves, future growth and expansion, future exploration, future seismic data, expansion of operations, our ability to generate new prospects, our ability to obtain a production license, review of outside generated prospects and acquisitions, additional reserves and reserve increases, managing our asset base, expansion and improvement of capabilities, integration of new technology into operations, credit facilities, new prospects and drilling locations, future capital expenditures and working capital, sufficiency of future working capital, borrowings and capital resources and liquidity, projected cash flows from operations, future commodity price environment, expectations of timing, the outcome of legal proceedings, satisfaction of contingencies, the impact of any change in accounting policies on our financial statements, the number, timing or results of any wells, the plans for timing, interpretation and results of new or existing seismic surveys or seismic data, future production or reserves, future acquisitions of leases, lease options or other land rights, management’s assessment of internal control over financial reporting, financial results, opportunities, growth, business plans and strategy and other statements that are not historical facts contained in this report are forward-looking statements. When used in this document, words like “expect,” “project,” “estimate,” “believe,” “anticipate,” “intend,” “budget,” “plan,” “forecast,” “predict,” “may,” “should,” “could,” “will” and similar expressions are also intended to identify forward-looking statements. Such statements involve risks and uncertainties, including, but not limited to, market factors, market prices (including regional basis differentials) of natural gas and oil, results for future drilling and marketing activity, future production and costs and other factors detailed herein and in our other Securities and Exchange Commission filings. Should one or more of these risks or uncertainties materialize, or should underlying assumptions prove incorrect, actual outcomes may vary materially from those indicated. These forward-looking statements speak only as of their dates and should not be unduly relied upon. We undertake no obligation to publicly update or revise any forward-looking statement, whether as a result of new information, future events or otherwise.
Throughout this annual report all references to dollar amounts ($) refers to U.S. dollars unless otherwise indicated.
PART I
Item 1. Business
Overview
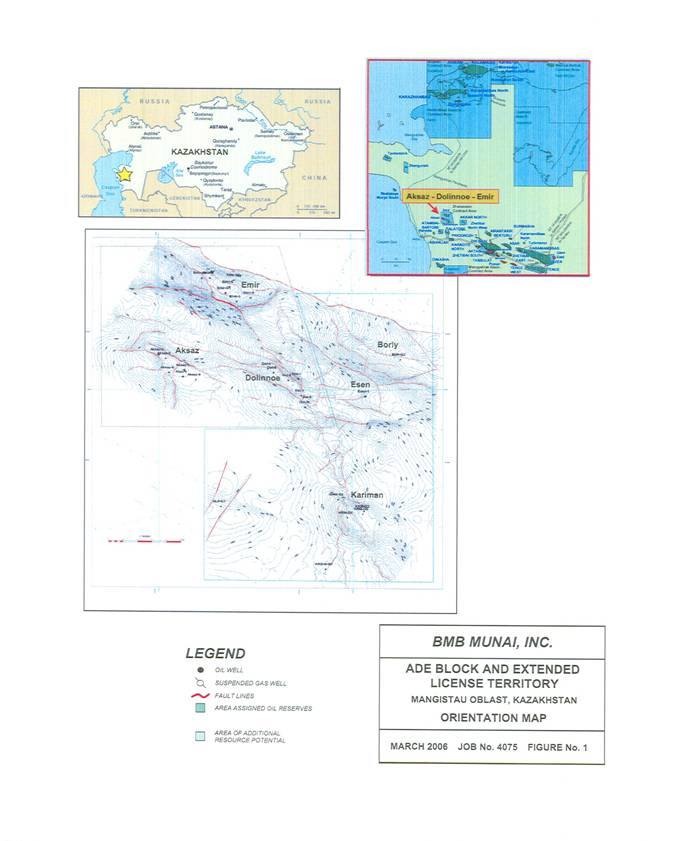
BMB Munai, Inc. is an independent oil and natural gas company engaged in the exploration, development, acquisition and production of crude oil and natural gas properties in the Republic of Kazakhstan (sometimes also referred to herein as the “ROK” or “Kazakhstan”). We hold a contract that allows us to explore and develop approximately 460 square kilometers in western Kazakhstan located onshore in the Mangistau Oblast, approximately 50 kilometers from the Kazakhstan city of Aktau, a seaport on the Caspian Sea.
4
We generate revenue, income and cash flow by producing and selling crude oil from production from our properties. We make significant capital expenditures in our exploration and development activities that we anticipate will allow us to increase and improve our ability to generate revenue. Our focus is toward enhancing cash flows and increasing proved developed reserves by drilling developmental wells within a proximity of existing wells, (which we believe decreases our likelihood of drilling a dry hole), while at the same time increasing our current production and cash flow. As cash flow justifies, we will drill exploratory wells to confirm potential reservoirs identified by the 3D seismic studies or extend known reservoirs. We believe this strategy will result in growth of proved developed reserves, production and financial strength.
To date, we have relied primarily on funds raised through the sale of our equity securities to fund operations. We currently use more cash in operations than we generate. Although presently the revenues derived from our properties are sufficient to meet our operating needs, exclusive of our drilling program, we will need additional financing to continue exploration activities on our properties.
Industry and Economic Factors
In managing our business, we must deal with many factors inherent in our industry. First and foremost is the fluctuation of oil and gas prices. Historically, oil and gas markets have been cyclical and volatile, with future price movements that are difficult to predict. While our revenues are a function of both production and prices, wide swings in commodity prices will likely have the greatest impact on our results of operations. We have no way of predicting those prices or of controlling them without losing an advantage from a potential upswing. The oil and gas industry has continued to experience high commodity prices in 2006 and 2007, which has positively impacted the entire industry as well as our Company.
Our operations entail significant complexities. Advanced technologies requiring highly trained personnel are utilized in both exploration and development. Even when the technology is properly used, we still may not know conclusively whether hydrocarbons will be present nor the rate at which they may be produced. Despite our best efforts to limit risk, exploration is a high-risk activity, often times resulting in no discovery of commercially productive reserves. Moreover, operating costs in our industry are substantial.
Our business, as with other extractive industries, is a depleting one in which each oil and gas equivalent produced must be replaced or our business, and a critical source of future liquidity, will shrink.
Strategy
Our goal is to increase stockholder value by investing in oil and natural gas projects with attractive rates of return on capital employed. We plan to achieve this goal by exploiting and developing our existing oil and gas properties and pursuing the acquisition of additional properties. We have and will continue to focus on the following:
Increasing our Production and Cash Flow. To sustain our operations we need capital. To date most of our operating capital has come from the sale of our securities. We believe that to increase shareholder value and economic stability, we must increase our revenues through increased production. For this reason, we have focused our efforts on drilling developmental
5
wells strategically located within proved areas with the intent to drill wells with a high probability of success. We believe this strategy will allow us to increase our current production and correspondingly our cash flows.
Developing and Exploiting Existing Properties. We believe that there is significant value to be created by drilling the identified undeveloped opportunities on our properties. We own interest in 720 gross (720 net) developed acres, plus 160 gross (160 net) acres of proved undeveloped reserves. We also own interest in approximately 49,150 gross (49,150 net) unproved, undeveloped acres. We plan to continue exploration, development, production and further infrastructure development during the 2008 fiscal year. We expect to fund our expenditures with future production revenues and a combination of commercial debt and the issuance of corporate debt and/or equity securities.
Pursuing Profitable Acquisitions. While our emphasis in fiscal 2008 is anticipated to focus on the further development of our existing properties, we will continue to look for properties with both existing cash flow from production and future development potential. We intend to pursue acquisitions of properties that we believe will provide attractive rates of return on capital invested. We have an experienced team of management professionals who we rely on to identify and evaluate acquisition opportunities.
Oil and Natural Gas Reserves
The following table sets forth our estimated net proved oil and natural gas reserves and the standardized measure of discounted future net cash flows related to such reserves as of March 31, 2007. We engaged Chapman Petroleum Engineering, Ltd. (“Chapman”), to estimate our net proved reserves, projected future production and the standardized measure of discounted future net cash flows as of March 31, 2007. Chapman’s estimates are based upon a review of production histories and other geologic, economic, ownership and engineering data provided by us. Chapman has independently evaluated our reserves for the past twelve months. In estimating the reserve quantities that are economically recoverable, Chapman used oil and natural gas prices in effect as of March 31, 2007 without giving effect to hedging activities. In accordance with requirements of the Securities and Exchange Commission (the “SEC”) regulations, no price or cost escalation or reduction was considered by Chapman. The standardized measure of discounted future net cash flows is not intended to represent the current market value of our estimated oil and natural gas reserves. The oil and natural gas reserve data included in or incorporated by reference in this document are only estimates and may prove to be inaccurate.
6
|
|
Proved reserves to be recovered by June 30, 2009(1) |
|
Proved reserves to be recovered after June 30, 2009(1) |
|
|
||||
|
|
Developed(2) |
|
Undeveloped(3) |
|
Developed(2) |
|
Undeveloped(3) |
|
Total |
|
Oil and condensate (MBbls)(4) |
2,275 |
|
242 |
|
9,579 |
|
3,185 |
|
15,281 |
|
Natural gas (MMcf) |
- |
|
- |
|
- |
|
- |
|
- |
|
Total BOE (MBbls) |
2,275 |
|
242 |
|
9,579 |
|
3,185 |
|
15,281 |
|
|
|
|
|
|
|
|
|
|
|
|
Standardized Measure of discounted future net cash flows(5) (in thousands of U.S. Dollars) |
|
|
|
|
|
|
|
|
$171,265 |
|
(1) |
Under our license with the Republic of Kazakhstan we have the right to sell the oil and natural gas we produce while we undertake exploration stage activities within our licensed territory. As discussed in more detail in “Risk Factors” and “Description of Properties” we have the right to engage in exploration stage activities until June 30, 2009. To retain our rights to produce and sell oil and natural gas after that date, we must apply for and be granted commercial production rights by no later than June 30, 2009. If we are not granted commercial production rights by that time, we would expect to lose our rights to the licensed territory and would expect to be unable to produce reserves after June 30, 2009. |
|
(2) |
Proved developed reserves are proved reserves that are expected to be recovered from existing wells with existing equipment and operating methods. |
|
(3) |
Proved undeveloped reserves are proved reserves which are expected to be recovered from new wells on undrilled acreage or from existing wells where a relatively major expenditure is required for recompletion. |
|
(4) |
Includes natural gas liquids. |
|
(5) |
The standardized measure of discounted future net cash flows represents the present value of future net cash flow net of all taxes. |
The reserve data set forth herein represents estimates only. Reserve engineering is a subjective process of estimating underground accumulations of oil and natural gas that cannot be measured in an exact manner. The accuracy of any reserve estimate is a function of the quality of available data and of engineering and geological interpretation and judgment. As a result, estimates made by different engineers often vary from one another. In addition, results of drilling, testing and production subsequent to the date of an estimate may justify revision of such estimates, and such revisions may be material. Accordingly, reserve estimates are generally different from the quantities of oil and natural gas that are ultimately recovered. Furthermore, the estimated future net revenue from proved reserves and the present value thereof are based upon certain assumptions, including current prices, production levels and costs that may not be what is actually incurred or realized.
No estimates of proved reserves comparable to those included herein have been included in reports to any federal agency other than the SEC.
In accordance with SEC regulations, the Chapman Report used oil and natural gas prices in effect at March 31, 2007. The prices used in calculating the standardized measure of discounted future net cash flows attributable to proved reserves do not necessarily reflect market prices for oil and natural gas production subsequent to March 31, 2007. There can be no assurance that all of the proved reserves will be produced and sold within the periods indicated, that the assumed prices will actually be realized for such production or that existing contracts will be honored or judicially enforced.
7
Sales to Major Customers
We are now exporting all of our test production for sale in the world market. Currently, all of our production is being sold to one client, Euro-Asian Oil AG. We anticipate that once we move to commercial production we will market our production to third parties consistent with industry practices.
Our crude oil is transported via the Aktau sea port to world markets. Sales prices at the port locations are based on the average quoted Brent crude oil price from Platt’s Crude Oil Marketwire for the three days following the bill of lading date less discount of $14.15 for transportation expenses, freight charges and other expenses borne by Euro-Asian Oil AG.
In the exploration, development and production business, production is normally sold to relatively few customers. Our customers are concentrated in the oil and gas industry, and revenue can be materially affected by current economic conditions and the price of certain commodities such as natural gas and crude oil the cost of which is passed through to the customer. However, based on the current demand for natural gas and crude oil and the fact that alternate purchasers are readily available, we believe that the loss of Euro-Asian Oil AG would not have a long–term material adverse effect on our operations.
Marketing
There are a variety of factors which affect the market for oil and natural gas, including the extent of domestic production and imports of oil and natural gas, the availability, proximity and capacity of natural gas pipelines and other transportation facilities, demand for oil and natural gas, the marketing of competitive fuels and the effects of state and federal regulations on oil and natural gas productions and sales.
Competition
Hydrocarbons exploration is highly competitive. Competition in Kazakhstan and Central Asia includes other junior hydrocarbons exploration companies, mid-size producers and major exploration and production companies. We compete for additional exploration and production properties with these companies who in many cases may have greater financial resources and larger technical staff than we do.
We believe we have an advantage over our competitor: our executive management and our board of directors have domestic and international experience and have been working in Kazakhstan and Russia for up to 30 years. They have developed relationships with the Kazakhstan government, its departments and ministries at many levels. We also employ experienced national and foreign specialists at senior levels in our operating subsidiary, Emir Oil, LLP.
We face significant competition for capital from other exploration and production companies and industry sectors. At times, other industry sectors may be more in favor with investors, limiting our ability to obtain necessary capital.
8
Government Regulation
Our operations are subject to various levels of government controls and regulations at various levels in both the United States and in Kazakhstan. We attempt to comply with all legal requirements in the conduct of our operations and employ business practices that we consider to be prudent under the circumstances in which we operate. It is not possible for us to separately calculate the costs of compliance with environmental and other governmental regulations as such costs are an integral part of our operations.
In Kazakhstan, legislation affecting the oil and gas industry is under constant review for amendment or expansion. Pursuant to such legislation, various governmental departments and agencies have issued extensive rules and regulations which affect the oil and gas industry, some of which carry substantial penalties for failure to comply. These laws and regulations can have a significant impact on the industry by increasing the cost of doing business and, consequentially, can adversely affect our profitability. Inasmuch as new legislation affecting the industry is commonplace and existing laws and regulations are frequently amended or reinterpreted, we are unable to predict the future cost or impact of complying with such laws and regulations.
Employees
As of May 15, 2007 we had 261 full-time employees. We believe that our relationships with our employees are good. None of our employees are covered by a collective bargaining agreement. From time to time we utilize the services of independent consultants and contractors to perform various professional services. Field and on-site production operation services, such as pumping, maintenance, dispatching, inspection and testing are generally provided by independent contractors.
Executive Offices
Our principal executive and corporate offices are located in an office building located at 202 Dostyk Avenue, in Almaty, Kakzakhstan. We lease this space and believe it is sufficient to meet our needs for the foreseeable future.
We also maintain an administrative office in Salt Lake City, Utah. The address is 324 South 400 West, Suite 250, Salt Lake City, Utah 84101, USA.
Reports to Security Holders
We file Annual Reports on Form 10-K, Quarterly Reports on Form 10-Q, Current Reports on Form 8-K and other items with the Securities and Exchange Commission (SEC). We provide free access to all of these SEC filings, as soon as reasonably practicable after filing, on our Internet web site located at www.bmbmunai.com. In addition, the public may read and copy any documents we file with the SEC at the SEC’s Public Reference Room at 100 F Street N.E., Washington, DC 20549. The public may obtain information on the operation of the Public Reference Room by calling the SEC at 1-800-SEC-0330. The SEC maintains its Internet site www.sec.gov, which contains reports, proxy and information statements and other information regarding issuers like BMB Munai.
9
|
Item 1A. Risk Factors |
A substantial or extended decline in oil prices may adversely affect our business, financial condition, cash flow, liquidity or results of operations, ourability to meet our capital expenditure obligations and financial commitments or to implement our business strategy.
Our business isheavily dependent upon the price of and demand for oil production and the level of such production will be subject to wide fluctuations and depend on numerous factors beyond our control, including the following:
|
|
• |
the domestic and foreign supply of oil; |
|
|
• |
the price and quantity of imports of crude oil; |
• political conditions and events in other oil-producing countries, including embargoes, continued hostilities in the Middle East, Iran, Nigeria and other sustained military campaigns, and acts of terrorism or sabotage;
|
|
• |
the actions of the Organization of Petroleum Exporting Countries, or OPEC; |
|
|
• |
domestic government regulation, legislation and policies; |
|
|
• |
the level of global oil inventories; |
|
|
• |
weather conditions; |
|
|
• |
technological advances affecting energy consumption; |
|
|
• |
the price availability of alternative fuels; and |
|
|
• |
overall economic conditions. |
Any continued or extended decline in the price of crude oil or natural gas will adversely affect:
|
|
• |
our revenues, profitability and cash flow from operations; |
|
|
• |
the value of our proved oil reserves; |
|
|
• |
the economic viability of certain of our drilling prospects; |
|
|
• |
our borrowing capacity; and |
|
|
• |
our ability to obtain additional capital. |
In December 2005 we were granted our first export quota from the Ministry of Energy and Mineral Resources of the Republic of Kazakhstan (“MEMR”), which allowed us to begin exporting oil for sale in the world market in January 2006. We have applied for and been granted an export quota each month since, with the exception of February 2006, when we did not apply for a quota. Prior to January 2006, we were limited to selling our test production to the domestic market in Kazakhstan. The price of oil in the domestic market in Kazakhstan is materially lower than the price in the world market. There is no guarantee that the Republic of Kazakhstan will continue to grant us export quotas in the future. In the event we are not granted an export quota in the future, we will be limited to selling our production to the domestic Kazakhstan market, which likely will result in us realizing lower revenue per barrel of oil sold than we would realize in the world market.
We have not entered into crude oil hedging arrangements on any of our anticipated sales. However, we may in the future enter into such arrangements in order to reduce our exposure to price risks. Such arrangements may limit our ability to benefit from increases in oil prices.
10
Reserve estimates depend on many assumptions that may turn out to be inaccurate. Any material inaccuracies in these reserve estimates or underlying assumptions will materially affect the quantities and present value of our reserves.
The process of estimating oil and natural gas reserves is complex. It requires interpretations of available technical data and many assumptions, including assumptions relating to economic factors. Any significant inaccuracies in these interpretations or assumptions could materially affect the estimated quantities and present value of reserves shown in this report.
In order to prepare estimates, we must project production rates and timing of development expenditures. We must also analyze available geological, geophysical, production and engineering data. The extent, quality and reliability of this data can vary. The process also requires economic assumptions about matters such as oil and natural gas prices, drilling and operating expenses, capital expenditures, taxes and availability of funds. Therefore, estimates of oil and natural gas reserves are inherently imprecise.
Actual future production, oil and natural gas prices, revenues, taxes, development expenditures, operating expenses and quantities of recoverable oil and natural gas reserves most likely will vary from our estimates. Any significant variance could materially affect the estimated quantities and present value of reserves shown in this report. In addition, we may adjust estimates of proved reserves to reflect production history, results of exploration and development, prevailing oil and natural gas prices and other factors, many of which are beyond our control.
You should not assume that the present value of future net revenues from our proved reserves referred to in this report is the current market value of our estimated oil and natural gas reserves. In accordance with SEC requirements, we generally base the estimated discounted future net cash flows from our proved reserves on prices and costs on the date of the estimate. Actual future prices and costs may differ materially from those used in the present value estimate. If future values decline or costs increase, it could have a negative impact on our ability to finance operations; individual properties could cease being commercially viable; affecting our decision to continue operations on producing properties or to attempt to develop properties. All of these factors would have a negative impact on earnings and net income, and most likely the trading price of our securities.
Twenty two percent of our proven properties are undeveloped; therefore the risk associated with our success is greater than would be the case if all of our properties were categorized as “proved developed producing.”
Because a portion of our proved reserves (approximately 22%) are “Proved Undeveloped” additional capital for the drilling and completion of an additional well will be required before these reserves become productive. Further, because of the inherent uncertainties associated with drilling for oil and gas, this well may never be developed to the extent that it develops into positive cash flow. Even if we are successful in our development efforts, it could take several years to achieve positive cash flow from our proved undeveloped reserves.
11
We will be unable to produce up to 84% of our proved reserves if we are not able to extend our current contract or obtain a new contract from the Republic of Kazakhstan, which would likely require us to terminate our operations.
Under our current contract for exploration of hydrocarbons on our properties we have the right to produce oil and gas only until July 2009, yet 84% of our proved reserves are scheduled to be produced after July 2009. We have the exclusive right to negotiate a commercial production contract as per the terms of our exploration contract. The MEMR does not make public its determinations on the granting of commercial production rights. Based on discussions with the MEMR, we have learned that the primary factors used by the MEMR in determining whether to grant commercial production rights were whether the contract holder’s fulfillment of minimum work program commitments, proof of commercial discovery and submission of an approved development plan by a third-party petroleum institute in Kazakhstan to exploit the established commercial reserves. Typically, if commercial production rights are not granted it is because the contract holder has failed to make a commercial discovery within their contract territory and had decided to abandon the contract territory or the contract holder has insufficient funds to complete its minimum work program requirement and was unable to complete the necessary work to substantiate the presence of commercially producible reserves to the MEMR. Our efforts are focused toward meeting our minimum work program requirements and making and substantiating commercial discoveries in each of identified structures to support our application for commercial production rights. If we are not granted commercial production rights prior to the expiration of our exploration contract, we may lose our right to produce the reserves on our current properties. If we are unable to produce those reserves, we will be unable to realize revenues and earnings and to fund operations and we would most likely be unable to continue as a going concern.
Prospects that we decide to drill may not yield oil or natural gas in commercially viable quantities or quantities sufficient to meet our targeted rate of return.
A “prospect” is a property which, based on available seismic and geological data, we believe shows potential oil or natural gas. Our prospects are in various stages of evaluation and interpretation. There is no way to accurately predict in advance of incurring drilling and completion costs whether a prospect will be economically viable. Even with seismic data and other technologies and the study of producing fields in the same area, we cannot know conclusively prior to drilling whether oil or natural gas will be present or, if present, will be present in commercial quantities. The analysis that we perform using data from other wells, more fully explored prospects and /or producing fields may not be useful in predicting the characteristics and potential reserves associated with our drilling prospects. If we drill additional unsuccessful wells, our drilling success rate may decline and we may not achieve our targeted rate of return.
We may incur substantial losses and be subject to substantial liability claims as a result of our operations.
We are not insured against all risks. Losses and liabilities arising from uninsured and underinsured events could materially and adversely affect our business, financial condition or results of operations. Our oil and natural gas exploration and production activities are subject to all of the operating risks associated with drilling for and producing oil and natural gas, including the possibility of:
12
|
|
• |
environmental hazards, such as uncontrollable flows of oil, natural gas, brine, well fluids, toxic gas or other pollution into the environment, including groundwater and shoreline contamination; |
|
|
• |
abnormally pressured formations; |
|
|
• |
mechanical difficulties, such as stuck oil field drilling and service tools and casing collapse; |
|
|
• |
fires and explosions; |
|
|
• |
personal injuries and death; and |
|
|
• |
natural disasters. |
Any of these risks could adversely affect our ability to conduct operations or result in substantial losses. We may elect not to obtain insurance if we believe that the cost of available insurance is excessive relative to the risks presented. In addition, pollution and environmental risks generally are not fully insurable. If a significant accident or other event occurs that is not fully covered by insurance, it could adversely affect us.
We are subject to complex laws that can affect the cost, manner or feasibility of doing business.
Exploration, development, production and sale of oil and natural gas are subject to extensive federal, state, local and international regulation. We may be required to make large expenditures to comply with governmental regulations. Matters subject to regulation include:
|
|
• |
discharge permits for drilling operations; |
|
|
• |
drilling bonds; |
|
|
• |
reports concerning operations; |
|
|
• |
The spacing of wells; |
|
|
• |
unitization and pooling of properties; and |
|
|
• |
taxation. |
Under these laws, we could be liable for personal injuries, property damage and other damages. Failure to comply with these laws may also result in the suspension or termination of our operations and subject us to administrative, civil and criminal penalties. Moreover, these laws could change in ways that substantially increase our costs. Any such liabilities, penalties, suspensions, terminations or regulatory changes could materially adversely affect our financial condition and results of operations.
We may incur substantial liabilities to comply with environmental laws and regulations.
Our oil and natural gas operations are subject to stringent federal, state and local laws and regulations relating to the release or disposal of materials into the environment or otherwise relating to environmental protection. These laws and regulations may require the acquisition of permits before drilling commences, restrict the types, quantities and concentration of substances that can be released into the environment in connection with drilling and production activities, limit or prohibit drilling activities on certain lands lying within wilderness, wetlands and other protected areas, and impose substantial liabilities for pollution resulting from our operations. Failure to comply with these laws and regulations may result in the assessment of administrative, civil and criminal penalties, imposition of investigatory or remedial obligations or even injunctive relief. Changes in
13
environmental laws and regulations occur frequently. Any changes that result in more stringent or costly waste handling, storage, transport, disposal or cleanup requirements could require us to make significant expenditures to maintain compliance, and may otherwise have a material adverse effect on our results of operations, competitive position or financial condition as well as on the industry in general. Under these environmental laws and regulations, we could be held strictly liable for the removal or remediation of previously released materials or property contamination regardless of whether we were responsible for the release or whether our operations were standard in the industry at the time they were performed.
Unless we replace our oil and natural gas reserves, our reserves and future production will decline, which would adversely affect our cash flows and income.
Unless we conduct successful development, exploration and exploitation activities or acquire properties containing proved reserves, our proved reserves will decline as those reserves are produced. Producing oil and natural gas reservoirs generally are characterized by declining production rates that vary depending upon reservoir characteristics and other factors. Our future oil and natural gas reserves and production, and, therefore our cash flow and income, are highly dependent on our success in efficiently developing and exploiting our current reserves and economically finding or acquiring additional recoverable reserves. If we are unable to develop, exploit, find or acquire additional reserves to replace our current and future production, our cash flow and income will decline as production declines, until our existing properties would be incapable of sustaining commercial production.
Our activities, and correspondingly our ability to generate revenue to support operations, could be adversely affected because of inadequate infrastructure in the region where our properties are located.
Our exploration and development activities could suffer due to inadequate infrastructure in the region. We are working to improve the infrastructure on our properties. Any problem or adverse change affecting our operational infrastructure, or infrastructure provided by third parties, could have a material adverse effect on our financial condition and results of operations. Similarly, if we are unsuccessful in developing the infrastructure on our properties it could have a material adverse effect on our financial conditions and results of operations.
The unavailability or high cost of drilling rigs, equipment, supplies, personnel and oil field services could adversely affect our ability to execute on a timely basis our exploration and development plans within our budget.
Shortages or the high cost of drilling rigs, equipment, supplies or personnel could delay or adversely affect our development and exploration operations. As the price of oil and natural gas has remained high, demand for production equipment and personnel has also remained high, resulting, in some cases in shortages of equipment and skilled personnel. In addition, larger producers may be able to secure access to such equipment by offering drilling companies more lucrative terms. As demand for services and personnel increases, the cost also increases, which can delay our ability to convert our reserves into cash flow as well as significantly increasing the cost of producing those reserves, thereby having a negative impact on anticipated net income.
14
The unavailability or high price of transportation systems could adversely affect our ability to deliver our oil on terms that would allow us to operate profitably, or at all.
Because of the location of our properties, the crude oil we produce must be transported by truck or by rail. In the future it will likely also be transported by pipelines. These railways and pipelines are operated by state-owned entities or other third parties, and there can be no assurance that these transportation systems will always be functioning and available, or that the transportation costs will remain at acceptable levels. In addition, any increase in the cost of transportation or reduction in its availability to us could have a material adverse effect on our results of operations. There is no assurance that we will be able to procure sufficient transportation capacity on economical terms, if at all.
Competition in the oil and natural gas industry is intense, which may adversely affect our ability to compete.
We operate in a highly competitive environment for acquiring properties, marketing oil and natural gas and securing trained personnel. Many of our competitors possess and employ financial, technical and personnel resources that are substantially greater than ours. Those companies may be able both to pay more for productive oil and natural gas properties and exploratory prospects and to evaluate, bid for and purchase a greater number of properties and prospects than our financial or personnel resources permit. Our ability to acquire additional prospects and to find and develop reserves in the future will depend on our ability to evaluate and select suitable properties and to consummate transactions in a highly competitive environment. There is substantial competition for capital available for investment in the oil and natural gas industry. We may not be able to compete successfully in the future in acquiring prospective reserves, developing reserves, marketing hydrocarbons, attracting and retaining quality personnel or raising additional capital.
Risks Relating to Our Business
If you purchase shares of our stock, your investment will be subject to the same risks inherent in international operations, including, but not limited to, adverse governmental actions, political risks, and expropriation of assets, loss of revenues and the risk of civil unrest or war.
We believe that the present policies of the government of the Republic of Kazakhstan are favorable to foreign investment and to exploration and production and we are not aware of any impending changes. While there is a certain amount of bureaucratic “red tape” we have significant experience working in Kazakhstan, and good relationships with government agencies at many levels.
We, however, remain subject to all the risks inherent in international operations, including adverse governmental actions, uncertain legal and political systems, and expropriation of assets, loss of revenues and the risk of civil unrest or war. Our primary oil and gas properties are located in Kazakhstan, which until 1990 was part of the Soviet Union. Kazakhstan retains many of the laws and customs of the former Soviet Union, but has and is continuing to develop its own legal, regulatory and financial systems. As the political and regulatory environment changes, we may face uncertainty about the interpretation of our agreements; in the event of dispute, we may have limited recourse within the legal and political system.
15
If we are successful in establishing commercially producible reserves on our properties, an application will be made for a commercial production contract. We have the exclusive right to negotiate this contract for the ADE Block and Extended Territory, and the government is required to conduct these negotiations under the “Law of Petroleum.” The terms of the commercial production contract will establish the royalty and other payments due to the government in connection with commercial production. At the time the commercial production contract is issued, we will be required to begin repaying the government its historical investment costs of exploration and development of the ADE Block and the Extended Territory. Our obligation associated with the ADE Block is approximately $6 million. Our obligation associated with the Extended Territory is approximately $5.3 million. If satisfactory terms for commercial production rights cannot be negotiated, it could have a material adverse effect on our financial position.
Item 1B. Unresolved Staff Comments
|
|
None. |
16
Item 2. Properties
17
We currently own a 100% interest in a license to use subsurface mineral resources and a hydrocarbon exploration contract issued by the ROK in 1999 and 2000, respectively (collectively referred to herein as the “license” or the “contract”). The original contract granted us the right to engage in exploration and development activities in an area of approximately 200 square kilometers referred to herein as the ADE Block. The ADE Block is comprised of three fields, the Aksaz, Dolinnoe and Emir fields. During our 2006 fiscal year our exploration contract was expanded to include an additional 260 square kilometers of land adjacent to the ADE Block, which we refer to as the “Extended Territory.” The Extended Territory is governed by the terms of the original contract. The ADE Block and the Extended Territory are sometimes collectively referred to herein as “our properties.”
When initially granted, the exploration and development stage of the contract had a five year term. The time for exploration and development was extended to July 9, 2007, with the right to seek an additional two-year extension. In February 2007 the MEMR granted our request for an extension of our exploration contract. Under the terms of the contract extension, the exploration period will extend to July 2009 over the entire exploration contract territory.
Under the terms of our contract we have the right to gather and sell all oil and natural gas we produce in test production until the expiration of our exploration contract, as extended, with the revenue from such sales belonging to BMB.
Under the statutory scheme in the Republic of Kazakhstan prospective oil fields are developed in two stages. The first stage is an exploration and appraisal stage during which a private contractor, such as BMB, is given a license to explore for oil and gas on a territory for a set term of years. During this stage the primary focus is on the search for a commercial discovery, i.e., a discovery of a sufficient quantity of oil and gas to make it commercially feasible to pursue execution of, or transition to, a production contract with the government.
In order to be assured that adequate exploration activities are undertaken by the contractor, the MEMR establishes an annual mandatory minimum work program to be accomplished in each year of the exploration contract. Under the minimum work program the contractor is required to invest a minimum dollar amount in exploration activities on the contract territory that may include geophysical studies, construction of field infrastructure or drilling activities. During the exploration stage, the contractor is also required to drill sufficient wells to establish the existence of commercially producible reserves in any structure for which it seeks a commercial production license. Failure to complete the minimum work program during the term of an exploration contract could preclude a contractor from receiving a longer-term production contract, regardless the success of the contractor in proving commercial reserves during the partial fulfillment of the minimum work program. Therefore, completion of the exploration contract’s minimum work program is essential to the success of any oil company working in Kazakhstan.
The contract we hold follows the above format. The contract sets the minimum dollar amount we must expend during each year of our work program. Under our exploration license our work program year ends on July 9 each year, whereas our fiscal year ends on March 31 each year. As a result of these timing differences, the amounts reflected in this table as “Actually Made” may differ from amounts disclosed elsewhere in our Management’s Discussion and Analysis or Consolidated Financial Statements, which present figures based on our fiscal year end rather than our work program year end.
18
|
Amount of Expenditure |
Prior to July 2005 |
July 2005 to July 2006 |
July 2006 to |
July 2007 to |
July 2008 to |
Total |
|
Mandated by Contract |
$21,500,000 |
$6,000,000 |
$12,700,000 |
$ 8,480,000 |
$70,000 |
$48,750,000 |
|
Actually Made |
$38,400,000 |
$12,700,000 |
$38,410,000* |
$ - |
$ - |
$88,510,000 |
* Investment as of March 31, 2007.
Under the rules of the MEMR there is an option for our expenditures above the minimum requirements in one period to be carried over to meet minimum obligations in future periods. As the above chart shows we have exceeded the minimum expenditure requirement in each period of the contract. In connection with the recent extension grant, the MEMR required an additional capital expenditures of $16,750,000 through the end of the extension period. We expect our planned drilling activities through 2009 to exceed the new amounts added to our minimum work program.
As noted above, from June 2006 through March 31, 2007 we invested approximately $38.4 million in the exploration and development of our properties. During the year ended March 31, 2007, we incurred and capitalized expenses of approximately $18.4 million attributable to drilling activities at the Kariman-1, Kariman-2, Dolinnoe-6 and Emir-6 wells during the year, as discussed in more detail below. We also incurred and capitalized approximately $6.2 million in well workover expenses, almost $1.3 million in geological and geophysical works and $9.5 million in materials used in exploration and development activities. Such capitalized costs are recorded as oil and gas properties on our balance sheet as at March 31, 2007. See Note 6 to Consolidated Financial Statements.
The second aspect of the mandatory minimum work program is the requirement that we drill a sufficient number of wells on any structure for which we seek commercial production rights to support our claim of a commercial discovery within the structure. Typically, one exploratory well and two appraisal wells are sufficient to support such a claim, although in some cases, commercial reserves have been demonstrated with fewer wells. The number of wells to be drilled is generally determined by the number of structures identified by the seismic studies done on a territory. The 3D seismic studies of our contract territory, as extended, have identified six potential structures. Therefore, we anticipate the need to drill up to 18 wells during the exploration phase of our contract as reflected on the top half of the following chart:
|
Structures |
Aksaz |
Dolinnoe |
Emir |
Kariman |
Borly |
Yessen |
|
Exploratory Wells |
1 |
1 |
1 |
1 |
1 |
1 |
|
Appraisal Wells |
2 |
2 |
2 |
2 |
2 |
2 |
|
|
|
|
|
|
|
|
|
Existing Wells |
2 |
4 |
1 |
2 |
0 |
0 |
|
Wells in Progress |
0 |
0 |
1 |
2 |
0 |
0 |
|
Remaining Wells to Drill by 2009 |
1 |
0 |
1 |
0 |
3 |
3 |
19
The bottom half of the above chart shows our current progress on drilling of exploratory and appraisal wells, the second aspect of our mandatory minimum work program. As the chart shows, for purposes of meeting the minimum work program requirements, we have nine wells completed and three wells currently in progress.
To date we have been conservative in our approach to exploration. It has been our practice to drill our first few wells serially. Our first well was the Dolinnoe-2 well drilled in 2004. This was followed by the Dolinnoe-3 well, and then the Aksaz-4 and Kariman-1 wells. We have verified the presence of oil and gas in all our wells thus far. We have expended substantial time and money to study our wells very closely.
It is important to remember that the purpose of the exploration stage is to study the geology and geophysical characteristics of each field and individual wells, with a view to qualifying for a longer-term production contract. Once drilling of a well is completed, our emphasis focuses on an extended period of testing a well’s production characteristics and capacities to determine the best method for producing oil from a well and to gain insight into the further development of the entire field. During this stage of exploration, oil production is subject to wide fluctuations caused by varying pressures commonly experienced by new wells and by significant periods of well closure to accommodate various mandatory testing. Maximizing oil production only becomes the central focus during the post-exploration phase when exploiting the commercial discovery commences under a production contract.
In addition to the wells currently in progress, we anticipate the need to complete up to eight additional wells by the end of the term of our exploration contract in order to qualify for a commercial production license on each of our structures. This will require that we continue to accelerate our drilling activities during the next two years if we wish to obtain commercial production rights for each of the structures within our properties.
Under our contract, we have the exclusive right to apply for and negotiate a commercial production contract. The government is required to negotiate the terms of these rights in good faith in accordance with the Law of Petroleum of Kazakhstan. Based on discussions with the MEMR, the primary factors used by the MEMR in determining whether to grant commercial production rights are whether the contract holder has fulfilled the minimum work program commitments, proved the existence of a commercial discovery and submitted and received approval of a development plan prepared by a third-party petroleum institute in Kazakhstan for the exploitation of the established commercial reserves. All our efforts during exploration stage have and will continue to focus on meeting these criteria. We have not yet applied for commercial production rights because we enjoy certain economic advantages during exploration and development.
The terms of our commercial production rights and royalty rates will be negotiated at the time we apply to move to commercial production. During exploration and development stage, we have the right to produce and sell oil and natural gas at a royalty rate of 2%. When we move to commercial production, the negotiated royalty rates may change depending on reserves and production rates. Royalty rates are established by the taxing authorities of the ROK and are based on production rates; the rate increases on a sliding scale. Current royalty rates range for 2% to 6%. We also anticipate that we will be required to pay rent export tax when we move to commercial production. The current rent export tax rate is tied to the Brent oil price; the rate increases on a sliding scale, at the present time it is 33%. Under our contract during exploration stage we are not required to pay rent export tax on the oil we sell to the world markets. We
20
anticipate that at the time we move to commercial production, the government will impose the rent export tax on all oil and natural gas we sell outside the domestic market in Kazakhstan.
Drilling Operations
The following table sets forth our drilling activity for the years ended March 31, 2005, March 31, 2006 and March 31, 2007. In the table, “Gross” refers to the total wells in which we have a working interest or back-in working interest after payout and “Net” refers to gross wells multiplied by our working interest therein.
|
|
March 31, 2007 |
|
March 31, 2006 |
|
March 31, 2005 | |||||||
|
|
|
Gross |
|
Net |
|
Gross |
|
Net |
|
Gross |
|
Net |
|
Exploratory: |
|
|
|
|
|
|
|
|
|
|
|
|
|
Productive |
|
- |
|
- |
|
- |
|
- |
|
- |
|
- |
|
Non-productive |
|
- |
|
- |
|
- |
|
- |
|
- |
|
- |
|
Total |
|
- |
|
- |
|
- |
|
- |
|
- |
|
- |
|
|
|
|
|
|
|
|
|
|
|
|
|
|
|
Development: |
|
|
|
|
|
|
|
|
|
|
|
|
|
Productive |
|
3 |
|
3 |
|
2 |
|
2 |
|
4 |
|
4 |
|
Non-productive |
|
- |
|
- |
|
- |
|
- |
|
- |
|
- |
|
Total |
|
- |
|
- |
|
- |
|
- |
|
- |
|
- |
|
Grand Total |
|
3 |
|
3 |
|
2 |
|
2 |
|
4 |
|
4 |
During the fourth quarter of fiscal 2006 we took steps to secure drilling rigs to allow us to accelerate our drilling activities over previous years. In January 2006 we signed one-year contracts with Great Wall, a Chinese drilling company, and Oil and Gas Exploration Krakow, a Polish drilling company, to furnish heavy rigs of sufficient size to drill wells to the depth of 4,000 meters, which is generally our target depth in Triassic carbonate structures. We also signed a turnkey contract with KandyagashBurService, LLP, a Kazakhstani drilling company, for drilling of new wells on the Emir oil field. In addition, we hired Great Wall to provide a lighter rig we use for completion, workover and testing activities on completed wells. Fiscal 2007 was the first year when we engaged in drilling several wells simultaneously compared to our drilling strategy in the past when we drilled wells serially.
During the fiscal year ended March 31, 2007, we drilled to deepen the Kariman–1 well, completed drilling of Dolinnoe-6 and Kariman-2 well and continued drilling of Emir-6 well. We also continued testing and development works on the Dolinnoe-1, Dolinnoe- 2, Dolinnoe- 3, Emir -1 and Aksaz -1 and Aksaz-4 wells.
In February 2006 we commenced drilling in the Extended Territory. Our initial project was increasing the depth of an existing non-producing well, which is designated as the Kariman-1 well. Drilling operations were conducted by Oil and Gas Exploration Kracow, Poland. The Kariman-1 well was cased to a depth of 1,661 meters and drilled to a total depth of 3,069 meters in 1967 by the Soviet government. Drilling was suspended at that depth because it was believed that the oil-bearing formations would not be found deeper than the lower Jurassic formations.
Our study of more recent advanced geological and geophysical information indicated that oil-bearing formations in the Kariman field are expected at a depth of 3,600 to 3,800 meters, through the Triassic formation. During reaming of the existing wellbore we discovered that the technical condition of the well had deteriorated significantly from the condition described in the original drilling logs. Because of the poor conditions within the wellbore, we began a sidetrack at 1,660 meters and essentially drilled a new bore from that depth.
21
Upon penetration the Middle Triassic formation between 3,356 and 3,361 meters we encountered very high formation pressure, additional intensive oil shows and a substantial increase in the gas content in drilling fluid. Therefore, as a safety precaution, we compensated by increasing drilling fluid weight. The increased weight of the required drilling fluid allowed us to determine that the Middle Triassic formation is characterized by abnormally high pressure of approximately 600 atmospheres.
Due to the high weight of the drilling fluid, beginning at 3,361 meters there was a loss circulation within the wellbore. Analysis of electric logging data determined that the loss circulation area was located at a depth of 1,660-1,860 meters. Therefore, we separated the loss circulation from the inflow by installing a cement plug and running casing to the depth of 3,100 meters.
Due to high pressure and strong degassing of drilling fluid in the penetrated portion of the Middle Triassic formations, our operations managers stopped drilling at a depth of 3,361 meters and retained Kezbie, a Kazakhstani company to commence well completion operations. Completion operations were followed by limited testing of a portion of the Kariman-1 well. The tests have been conducted in the open wellbore without perforation of the Upper Triassic formation, despite the fact that the flows from this horizon were partially locked by drilling fluid preliminary testing conducted during the first three days of testing yielded results ranging from 380 to 570 barrels per day.
Despite encouraging preliminary results of testing in the open wellbore, we decided to shut the well until arrival of a liner, smaller-diameter casing. The equipment has been procured and the casing was run-in during February-March of 2007. We intend to commence completion operations followed by extensive testing of the Upper Triassic sandstone formations during the first quarter of the 2008 fiscal year.
During the summer of 2007 we commenced drilling operations on three wells simultaneously, Kariman-2, Dolinnoe-6 and Borly-2.
Kariman-2, the first well drilled by us from surface, was spudded on August 15, 2006, by company contractor, Oil and Gas Exploration Krakow. The well is located 500 meters to the south of the Kariman-1 well. Drilling of the Kariman-2 was finished on December 25, 2006, with the final depth of 3,535 meters upon reaching the end of the targeted Middle Triassic horizons. Completion operations were completed by Burgylau LLP, a local contractor, during January 2007. We commenced testing of the well in February 2007. Since then the well has been steadily test producing with the range between 1,400 and 1,700 bpd on a 6mm choke.
Dolinnoe-6 well was spudded by our drilling contractor, Great Wall (China), on August 8, 2006. The well is located 800 meters to the southeast of the Dolinnoe-3 well drilled by the Company in 2005. Drilling operations were completed on January 23, 2007, with the final depth of 3,883 meters. Completion operations were subcontracted to Burgylau LLP and were carried out during March and April 2007. Completion operations were commenced at the end of March-beginning of April. We expect to continue intensive testing activities during the first quarter and to announce results of such testing upon receiving detailed information.
On July 5, 2006, our drilling contractor, Great Wall, has placed a 150-ton rig on Borly-2, well drilled to a depth of 2,382 meters during 1995 by MangyshlakMunaiGas, a subsidiary of the Kazakhstani National Oil and Gas Company. The well was previously cased to a depth of 1,900 meters. During the process we made a decision to cease and postpone re-entry operations on the well until a heavier rig becomes available.
22
On October 2, 2006, our third drilling contractor, KanyagashBurService LLP (KBS), completed mobilization of a 175-ton drilling rig and spudded a new well, designated Emir-6, on the Emir oil field. We signed a turnkey contract with the KBS for drilling of this well with a target depth of 3,100 meters. We expect drilling, completion and testing operations to be completed in the first quarter of fiscal year 2008.
Production
The following table sets forth the number of productive oil and natural gas wells in which we owned an interest as of March 31, 2007.
|
|
Company-operated |
|
Non-operated |
|
Total |
||||||
|
|
Gross |
|
Net |
|
Gross |
|
Net |
|
Gross |
|
Net |
|
|
|
|
|
|
|
|
|
|
|
|
|
|
Oil |
9 |
|
9 |
|
- |
|
- |
|
9 |
|
9 |
|
Natural Gas |
- |
|
- |
|
- |
|
- |
|
- |
|
- |
|
Total |
9 |
|
9 |
|
- |
|
- |
|
9 |
|
9 |
As of the end of the 2007 fiscal year we had nine wells in workover, testing or test production. According to the laws of the Republic of Kazakhstan, we are required to test every prospective object on our properties separately, this includes the completion of well surveys on different modes with various choke sizes on each horizon.
In the course of well testing, when the transfer from object to object occurs, the well must be shut in; oil production ceases for the period of mobilization/ demobilization of the workover rig, pull out of the hole, run in the hole, perforation, packer installation time, etc. This has the effect of artificially diminishing production rates averaged over a set period of time.
Our production figures for the month of March 2007 covering production from the ADE block and Kariman field in the extended license territory were as following: daily total high production was 2,693 bpd; daily total low production was 1,946 bpd with an average daily total production for the 31 days of March of 2,337 bpd. Because this only accounts for one zone per well, this may not be representative of the cumulative total production rate from all of the tested intervals in each of the wells.
Following is a brief description of the current production status of each of our nine wells and the Emir-6 well, which is nearing completion of drilling.
Aksaz -1
This well is currently not producing. Prior to workover, four producing intervals were tested. The single interval test production rates in Aksaz-1 using a 10 mm diameter choke was 140 bpd. We expect to undertake workover operations on this well, consisting primary of fishing works, once the workover rig will become available following testing of the Dolinnoe-6, Kariman-1 and Emir-6 wells.
Aksaz – 4
Drilling of this well was completed in August 2005. Two producing intervals have been tested. Current production rates from single interval testing using a 6 mm diameter choke ranges from 76 to 107 bpd.
23
Dolinnoe – 1
During the third quarter of fiscal 2007 we conducted workover operations on this well and it is currently producing. Production rates from single interval testing using a 6 mm diameter choke ranges from 221 to 438 bpd.
Dolinnoe – 2
This well is also producing. Current production rates from single interval testing using a 8 mm diameter choke ranges from 32 to 290 bpd.
Dolinnoe – 3
This well was initially completed to a depth of 3,800 meters in September 2005. During initial testing, we were able to perforate only 17 of 24 meters of the producing interval because of intensive oil and gas shows. Subsequent perforation of the remaining 7 meters of the interval was disrupted when tubing was impacted by the heavy drilling mud components, and the blowout preventer was damaged, which required the forced killing of the well. Although we were able to restore limited oil production from the well, the production was substantially lower than the well’s initial test production performance. We have conducted numerous tests during the past six months in an effort to increase daily production rates to levels consistent with management expectations. In August 2006 we completed the acid treatment of the Dolinnoe-3 well. During the ten days following completion of the acid treatment the well produced between 460 and 630 bpd while being tested using chokes between 6mm and 10mm in size. We believe these initial test results indicate that we have developed a suitable hydrochloric acid formula to conduct effective acid treatment of the carbonate formations with temperature and pressure conditions characterized by the Dolinnoe field. Current production rates from single interval testing using an 8 mm diameter choke range from 170 to 347 bpd. We plan to continue application of acid treatment to Dolinnoe field wells to stimulate production from such wells.
Dolinnoe - 6
Drilling of the Dolinnoe-6 well was completed on January 23, 2007. This well was drilled through the full Middle Triassic layer to a depth of 3,883 meters. Completion activities have been performed and testing of the well commenced in the third week of March. Stable production estimates will not be available until conclusion of the testing period.
Emir – 1
This well currently is not producing. Single interval production from this well prior to workover was 1.3 to 9.5 bpd.
Emir - 6
Drilling of the Emir-6 well has been completed on June 2, 2007. This well was drilled to a depth of 3,197 meters. Completion activities have been performed and we anticipate perforating the well within the next two weeks. Following perforation of the well, we will begin the testing.
24
Kariman - 1
Re-entry of the Kariman-1 well was completed on June 30, 2006 and well completion to the upper Triassic formation was completed by July 17, 2006. Despite the fact that the flows from this horizon are partially blocked by drilling fluid, preliminary testing conducted during the first month of testing using chokes ranging from 20 mm to 30 mm yielded results ranging from 380 to 570 barrels per day. The well was then put into a pressure-build up test to better understand the source of the high pressures encountered during earlier re-entry operations at the upper four meters of Middle Triassic formation. We have obtained and run down a specialized low diameter casing in the well. Perforation and subsequent testing of Upper Triassic sandstone formations are scheduled for the first quarter of fiscal 2008.
Kariman – 2
This well was spudded on August 15, 2006, and is the first well we have drilled from the surface in the Kariman oil field. Drilling of the Kariman-2 well was finished on December 25, 2006. Drilling operations were concluded at the depth of 3,535 meters, upon reaching the end of the targeted Middle Triassic horizons.
Well completion activities were conducted utilizing a drilling rig specifically employed for workover and completion operations. Subsequent testing of the well during the months of February and March yielded test production ranging from 996 to 1,859 bpd with steady production in the range of 1,400 to 1,700 bpd. We plan to continue test production from this well.
Cost Information
|
|
Capitalized Costs |
Capitalized costs and accumulated depletion, depreciation and amortization relating to our oil and natural gas producing activities, all of which are conducted in the Republic of Kazakhstan, are summarized below:
|
|
As of March 31, 2007 |
|
As of March 31, 2006 |
|
|
|
|
|
|
Developed oil and natural gas properties |
$ 82,311,230 |
|
$ 68,079,938 |
|
Unevaluated oil and natural gas properties |
25,279,813 |
|
- |
|
Accumulated depletion, depreciation and |
(3,403,475) |
|
(1,396,641) |
|
Net capitalized cost |
$ 104,187,568 |
|
$ 66,683,297 |
Exploration, Development and Acquisition Capital Expenditures
The following table sets forth certain information regarding the total costs incurred associated with exploration, development and acquisition activities.
26
|
|
|
For the year ended March 31, 2007 |
|
For the year ended March 31, 2006 |
|
For the year ended March 31, 2005 |
|
|
|
|
|
|
|
|
|
Acquisition costs: |
|
|
|
|
|
|
|
Unproved properties |
|
$ - |
|
$ - |
|
$ - |
|
Proved properties |
|
- |
|
- |
|
19,075,000 |
|
Exploration costs |
|
1,370,797 |
|
3,453,603 |
|
713,220 |
|
Development costs |
|
37,063,321 |
|
14,368,323 |
|
16,687,432 |
|
Subtotal |
|
38,434,118 |
|
17,821,926 |
|
36,475,652 |
|
Asset retirement costs |
|
1,076,987 |
|
856,302 |
|
60,973 |
|
Total costs incurred |
|
$ 39,511,105 |
|
$ 18,678,228 |
|
$ 36,536,625 |
Oil and Natural Gas Volumes, Prices and Operating Expense
The following table sets forth certain information regarding production volumes, average sales prices and average operating expense associated with our sale of oil and natural gas for the periods indicated.
|
|
For the Year Ended March 31, 2007 |
|
For the Year Ended March 31, 2006 |
|
For the Year Ended March 31, 2005 |
|
Production: |
|
|
|
|
|
|
Oil and condensate (Bbls) |
321,993 |
|
242,522 |
|
68,755 |
|
Natural gas liquids (Bbls) |
- |
|
- |
|
- |
|
Natural gas (Mcf) |
- |
|
- |
|
- |
|
Barrels of oil equivalent (BOE) |
321,993 |
|
242,522 |
|
68,755 |
|
|
|
|
|
|
|
|
Sales(1)(3): |
|
|
|
|
|
|
Oil and condensate (Bbls) |
315,540 |
|
227,976 |
|
64,084 |
|
Natural gas liquids (Bbls) |
- |
|
- |
|
- |
|
Natural gas (Mcf) |
- |
|
- |
|
- |
|
Barrels of oil equivalent (BOE) |
315,540 |
|
227,976 |
|
64,084 |
|
|
|
|
|
|
|
|
Average Sales Price(1): |
|
|
|
|
|
|
Oil and condensate ($ per Bbl) |
$ 50.03 |
|
$ 26.13 |
|
$ 15.19 |
|
Natural gas liquids ($ per Bbl) |
$ - |
|
$ - |
|
$ - |
|
Natural gas ($ per Mcf) |
$ - |
|
$ - |
|
$ - |
|
Barrels of Oil equivalent ($ per BOE) |
$ 50.03 |
|
$ 26.13 |
|
$ 15.19 |
|
|
|
|
|
|
|
|
Average oil and natural gas operating
expenses |
$ 7.20 |
|
$ 3.84 |
|
$ 6.34 |
(1) During the years ended March 31, 2007, 2006 and 2005, the Company has not engaged in any hedging activities, including derivatives.
(2) Includes transportation cost, production cost and ad valorem taxes.
(3) We use sales volume rather than production volume for calculation of per unit cost because not all volume produced is sold during the period. The related production costs were expensed only for the units sold, not produced based on a matching principle of accounting. Therefore, oil and gas operating expense per BOE was calculated by dividing oil and gas operating expenses for the year by the volume of oil sold during the year.
27
|
Item 3. |
Legal Proceedings |
In December 2003, a complaint was filed in the 15th Judicial Court in and for Palm Beach County, Florida, naming, among others, the Company and former directors, Georges Benarroch and Alexandre Agaian, as defendants. The plaintiffs, Brian Savage, Thomas Sinclair and Sokol Holdings, Inc., allege claims of breach of contract, unjust enrichment, breach of fiduciary duty, conversion and violation of a Florida trade secret statute in connection with a business plan for the development Aksaz, Dolinnoe and Emir oil and gas fields owned by Emir Oil, LLP. The parties mutually agreed to dismiss this lawsuit without prejudice.
In April 2005, Sokol Holdings, Inc., also filed a complaint in United States District Court, Southern District of New York alleging that BMB Munai, Inc., Boris Cherdabayev, and former BMB directors Alexandre Agaian, Bakhytbek Baiseitov, Mirgali Kunayev and Georges Benarroch wrongfully induced Toleush Tolmakov to breach a contract under which Mr. Tolmakov had agreed to sell to Sokol 70% of his 90% interest in Emir Oil LLP.
In October 2005, Sokol Holdings amended its complaint in the U.S. District Court in New York to add Brian Savage and Thomas Sinclair as plaintiffs and to add Credifinance Capital, Inc., and Credifinance Securities, Ltd., (collectively “Credifinance”) as defendants in the matter. The amended complaint alleges tortious interference with contract, specific performance, breach of contract, unjust enrichment and breach of fiduciary duty by Georges Benarroch, Alexandre Agaian and Credifinance, conversion, breach of fiduciary duty by Boris Cherdabayev, Mirgali Kunayev and Bakhytbek Baiseitov, misappropriation of trade secrets and tortuous interference with fiduciary duty by Mr. Agaian, Mr. Benarroch and Credifinance and aiding and abetting breach of fiduciary duty by Mr. Benarroch, Mr. Agaian and Credifinance in connection with a business plan for the development of the Aksaz, Dolinnoe and Emir oil and gas fields owned by Emir Oil, LLP. The plaintiffs have not named Toleush Tolmakov as defendant in the action nor have the plaintiffs ever brought claims against Mr. Tolmakov to establish the existence or breach of any legally binding agreement between the plaintiffs and Mr. Tolmakov. The plaintiffs seek damages in an amount to be determined at trial, punitive damages, specific performance and such other relief as the Court finds just and reasonable.
We have retained the law firm of Bracewell & Giuliani LLP in New York, New York to represent us in the lawsuit. We moved for dismissal of the amended complaint or for a stay pending arbitration in Kazakhstan. That motion was denied, without prejudice to renewing it, to enable defendants to produce documents to plaintiffs relating to the issues raised in the motion. Following completion of document production, the motion has been renewed. Briefing on the motion was completed on August 24, 2006, and the motion is awaiting decision. There are also pending discovery-related motions before the court awaiting decision.
In the opinion of management, the resolution of this lawsuit will not have a material adverse effect on our financial condition, results of operations or cash flows.
Other than the foregoing, to the knowledge of management, there is no other material litigation or governmental agency proceeding pending or threatened against the Company or our management.
|
Item 4. |
Submission of Matters to a Vote of Security Holders |
No matters were submitted to a vote of security holders and there were no changes in our board of directors during the quarter ended March 31, 2007.
28
PART II
|
Item 5. |
Market for Registrant’s Common Equity, Related Stockholder Matters and Issuer Purchases of Equity Market for our Common Stock |
Our common stock began trading on the American Stock Exchange under the symbol “KAZ” on September 21, 2006. Prior to that time, our common stock traded on the OTC Bulletin Board under the symbol “BMBM.” Our shares are also traded on XETRA , the Deutsche Borse electronic trading system under SE code DL-,001 DMW US09656A1051.
The following table presents the high and low sales price for the third and fourth quarters of the fiscal year ended March 31, 2007, as reported by the American Stock Exchange, and the high and low bid prices for the first and second quarters of the fiscal year ended March 31, 2007 and the fiscal year ended March 31, 2006. The published high and low bid quotations from the first quarter 2006 through second quarter 2007, were furnished to us by Pink Sheets, LLC. These quotations represent prices between dealers and do not include retail markup, markdown or commissions and may not represent actual transactions.
|
|
|
High |
|
Low |
|
|
|
|
|
|
|
Fiscal year ended March 31, 2007 |
|
|
|
|
|
|
|
|
|
|
|
Fourth quarter |
|
$ 5.49 |
|
$ 4.51 |
|
Third quarter |
|
$ 6.03 |
|
$ 4.56 |
|
Second quarter |
|
$ 8.80 |
|
$ 5.80 |
|
First quarter |
|
$ 10.65 |
|
$ 7.85 |
|
|
|
|
|
|
|
Fiscal year ended March 31, 2006 |
|
|
|
|
|
|
|
|
|
|
|
Fourth quarter |
|
$ 9.70 |
|
$ 6.70 |
|
Third quarter |
|
$ 7.50 |
|
$ 6.00 |
|
Second quarter |
|
$ 8.15 |
|
$ 4.65 |
|
First quarter |
|
$ 5.30 |
|
$ 4.01 |
Record Holders
As of June 7, 2007, we had approximately 428 shareholders of record holding 44,690,657 shares of our common stock. The number of record holders was determined from the records of our transfer agent and does not include beneficial owners of common stock whose shares are held in the names of various security brokers, dealers, and registered clearing agencies.
Dividend Policy
We have not declared or paid a cash dividend on our common stock during the past two fiscal years. Our ability to pay dividends is subject to limitations imposed by Nevada law. Under Nevada law, dividends may be paid to the extent that a corporation’s assets exceed it liabilities and it is able to pay its debts as they become due in the usual course of business. At the present time, our board of directors does not anticipate paying any dividends in the foreseeable future; rather, the board of directors intends to retain earnings that could be distributed, if any, to fund operations, expansion and development of our business.
29
Securities for Issuance Under Equity Compensation Plans
As of June 7, 2007, shares of our common stock were subject to issuance upon the exercise of outstanding options or warrants as set forth below.
|
Plan category
|
Number of securities to be issued upon exercise of outstanding options, warrants and rights
(a) |
Weighted-average exercise price of outstanding options, warrants and rights
(b) |
Number of securities remaining available for future issuance under equity compensation plans (excluding securities reflected in columns (a))
(c) |
|
Equity compensation plans approved by security holders |
1,173,583 |
$5.33 |
1,855,000 |
|
Equity compensation plans not approved by security holders |
142,857 |
$3.50 |
-0- |
|
Total |
1,316,440 |
$5.13 |
1,855,000 |
On November 19, 2003 we granted an option to Credifinance Securities Limited for services rendered by Credifinance as our agent in connection with private placements made by us in November 2003. The option grants Credifinance the right to purchase up to 142,857 shares of our common stock at an exercise price of $3.50 per share. The option expires on November 26, 2008. The option provides for adjustments to the number of shares and/or the price per share to protect the holder against dilution and in the event of mergers, reorganizations and similar events. The option also requires that in the event we determine to make a registered public offering during the term of the option, we shall use our best efforts to include the common shares underlying the options in the registration statement.
In November 2004 we agreed to grant stock options under our 2004 Stock Incentive Plan to Gary Lerner, our former corporate secretary, to purchase 60,000 shares of our common stock. The options have an exercise price of $4.00 per share and expire in October 2009. In April 2006, Mr. Lerner exercised options to purchase 7,200 shares of our common stock.
On July 18, 2005 our Board of Directors approved stock option grants and restricted stock awards under our 2004 Stock Incentive Plan. The total number of options and restricted stock grants was 820,783 and 469,217, respectively. The options are exercisable at a price of $4.75, the closing price of our common stock on the OTCBB on July 18, 2005. The options will expire five years from the grant date. Of the restricted stock grants, 389,217 vested immediately. The remaining shares will vest to the three individuals to whom they were granted in equal amounts upon the one year, two year and three year anniversaries of their employment with the Company. Among the parties receiving stock options and restricted stock grants were the following executive officers and directors:
30
|
Name |
|
Positions with Company |
|
Options Granted |
|
Restricted Stock Granted |
|
|
|
|
|
|
|
|
|
Boris Cherdabayev |
|
CEO and Director |
|
410,256 |
|
189,744 |
|
Anuar Kulmagambetov |
|
Former CFO |
|
232,632 |
|
107,368 |
|
Georges Benarroch |
|
Director |
|
68,421 |
|
31,579 |
|
Valery Tolkachev |
|
Director |
|
68,421 |
|
31,579 |
In January 2006, we entered into a separation agreement with our former CFO, Anuar Kulmagambetov, to issue Mr. Kulmagambetov 50,000 restricted common shares and an option to purchase up to 100,000 shares of restricted common stock of the Company at $7.40 per share expiring five years from the date of grant.
On June 20, 2006 our Board of Directors approved stock option grants and restricted stock awards to our officers and directors and certain employees and consultants of the Company under our 2004 Stock Incentive Plan. The total number of options and restricted stock grants was 200,000 and 495,000 respectively. The options are exercisable at a price of $7.00 per share, which was the closing price of our common stock on the OTCBB on June 20, 2006. The restricted stock grants were also valued at $7.00 per share. The options will expire three years from the grant date. All of the options and restricted stock grants have vested. Among the parties receiving restricted stock grants were the following executive officers and directors:
|
Name |
|
Positions with Company |
|
Options Granted |
|
Restricted Stock Granted |
|
|
|
|
|
|
|
|
|
Boris Cherdabayev |
|
CEO and Director |
|
150,000 |
|
80,000 |
|
Askar Tashtitov |
|
President |
|
- |
|
40,000 |
|
Sanat Kasymov |
|
CFO |
|
- |
|
40,000 |
|
Gamal Kulumbetov |
|
COO |
|
- |
|
40,000 |
|
Georges Benarroch |
|
Former Director |
|
- |
|
10,000 |
|
Troy Nilson |
|
Director |
|
- |
|
10,000 |
|
Stephen Smoot |
|
Director |
|
- |
|
10,000 |
|
Valery Tolkachev |
|
Director |
|
50,000 |
|
40,000 |
On March 30, 2007 we made restricted stock grants under the Plan to certain officers, employees and outside consultants under the Plan. The total number of restricted common shares granted was 950,000. The restricted stock grants were valued at $5.38 per share. The restricted stock grants were awarded on the same terms and subject to same vesting requirements. The restricted stock grants will vest to the grantees at such time as either of the following events occurs (the “Vesting Events”): i) the Company enters commercial production and is granted a commercial production license from the Republic of Kazakhstan; or ii) the occurrence of an Extraordinary Event. An “Extraordinary Event” is defined in the restricted stock agreement as any consolidation or merger of the Company or any of its subsidiaries with another person, or any acquisition of the Company or any of its subsidiaries by any person or group of persons, acting in concert, equal to thirty percent (30%) or more of the outstanding stock of the Company or any of its subsidiaries, or the sale of all or substantially all of the assets of the Company or any of its subsidiaries. In the event of an Extraordinary Event, the grants shall be deemed full vested one day prior to the effective date of the Extraordinary Event. The Board of Directors shall determine conclusively whether or not an Extraordinary Event has occurred and the grantees have agreed to be bound by the determination of the Board of Directors. The grantees have the right to vote the shares, receive dividends and enjoy all other rights of ownership over the entire grant amount from the grant date, except for the right to transfer, assign, pledge, encumber, dispose of or otherwise directly or indirectly profit or share in any profit derived from a transaction in the shares prior to the occurrence of a Vesting Event. Shares will only vest to the grantee if the grantee is employed by the Company at the time a Vesting Event occurs. If a
31
Vesting Event has not occurred at the time a grantee’s employment with the Company ceases, for any reason, the entire grant amount shall be forfeited back to the Company. Among the parties receiving restricted stock grants were the following executive officers and directors:
|
Name |
|
Positions with Company |
|
Restricted Stock Granted |
|
|
|
|
|
|
|
Boris Cherdabayev |
|
CEO and Director |
|
150,000 |
|
Askar Tashtitov |
|
President |
|
100,000 |
|
Sanat Kasymov |
|
CFO |
|
100,000 |
|
Gamal Kulumbetov |
|
COO |
|
100,000 |
Recent Sales of Unregistered Securities.
During and subsequent to the quarter ended March 31, 2007 the following equity securities, which were not registered under the Securities Act of 1933, were issued.
As discussed above, on March 30, 2007 we granted common stock to certain of our officers, employees and outside consultants under the Plan. The total number of restricted common shares granted was 950,000. For more details regarding the vesting of the restricted stock grants, please see the last paragraph of “Securities for Issuance Under Equity Compensation Plans” above. Among the parties receiving restricted stock grants were the following executive officers and directors:
|
Name |
|
Position with Company |
|
Restricted Stock Granted |
|
|
|
|
|
|
|
Boris Cherdabayev |
|
CEO and Director |
|
150,000 |
|
Gamal Kulumbetov |
|
COO |
|
100,000 |
|
Sanat Kasymov |
|
CFO |
|
100,000 |
|
Askar Tashtitov |
|
President |
|
100,000 |
Grants were made to 11 people, eight of whom are non-U.S. persons. The restricted stock grants were made without registration pursuant to Regulation S of the Securities Act Rules and Section 4(2) under the Securities Act of 1933.
As discussed above, the stock grants vest only upon the occurrence of a Vesting Event.
Issuer Repurchases
We did not make any repurchases of our equity securities during the year ended March 31, 2007.
Item 6. Selected Financial Data
The selected consolidated financial information set forth below is derived from our consolidated balance sheets and statements of operations as of and for the years ended March 31, 2007, 2006 and 2005 and for the period from inception (May 6, 2003) through March 31, 2004. The data set forth below should be read in conjunction with “Management’s Discussion and Analysis of Financial Condition and Results of Operations” and the consolidated financial statements and related notes thereto included in this Annual Report.
32
|
|
For the year ended March 31, |
|
For the period from
Inception
through |
||||
|
|
2007 |
|
2006 |
|
2005 |
|
|
|
Consolidated Statements of Operations Data: |
|
|
|
|
|
|
|
|
|
|
|
|
|
|
|
|
|
Revenues |
$ 15,785,784 |
|
$ 5,956,731 |
|
$ 973,646 |
|
$ - |
|
Oil and gas operating expenses |
2,272,251 |
|
875,319 |
|
406,361 |
|
- |
|
General and administrative expenses |
10,757,727 |
|
9,724,597 |
|
4,060,962 |
|
781,757 |
|
Depletion |
2,006,834 |
|
1,167,235 |
|
229,406 |
|
- |
|
Income/(loss) from operations |
404,843 |
|
(5,949,170) |
|
(3,789,534) |
|
(786,515) |
|
Net income/(loss) |
1,039,491 |
|
(5,344,333) |
|
(3,286,312) |
|
(613,782) |
|
Basic income/(loss) per common share |
0.02 |
|
(0.15) |
|
(0.12) |
|
(0.08) |
|
Diluted income/(loss) per common share |
0.02 |
|
(0.15) |
|
(0.12) |
|
(0.08) |
|
|
|
|
|
|
|
|
|
|
|
As of March 31, |
|
As of March 31, |
||||
|
|
2007 |
|
2006 |
|
2005 |
|
2004 |
|
Balance Sheet Data: |
|
|
|
|
|
|
|
|
|
|
|
|
|
|
|
|
|
Current assets |
$ 29,971,535 |
|
$ 57,336,327 |
|
$18,310,655 |
|
$ 5,711,523 |
|
Oil and gas properties, full cost method, net |
104,187,568 |
|
66,683,297 |
|
49,172,304 |
|
6,495,186 |
|
Total assets |
144,796,045 |
|
126,582,656 |
|
68,241,826 |
|
12,512,945 |
|
Total current liabilities |
9,120,299 |
|
4,623,975 |
|
6,997,671 |
|
666,719 |
|
Total long term liabilities |
10,114,126 |
|
7,329,877 |
|
6,653,215 |
|
242,000 |
|
Total Shareholders’ equity |
$125,561,620 |
|
$114,628,804 |
|
$54,590,940 |
|
$11,522,242 |
|
Item 7. |
Management’s Discussion and Analysis of Results of Operations |
This discussion summarizes the significant factors affecting our consolidated operating results, financial condition, liquidity and capital resources during the fiscal years ended March 31, 2007, 2006 and 2005. This discussion should be read in conjunction with the consolidated financial statements and footnotes to the consolidated financial statements included in this annual report.
Results of Operations
This section includes a discussion of our results of operations for the fiscal years ended March 31, 2007, 2006 and 2005. The following table sets forth selected operating data for the fiscal years indicated:
33
|
|
|
For the year ended March 31, 2007 |
|
For the year ended March 31, 2006 |
|
For the year ended March 31, 2005 |
|
Revenues: |
|
|
|
|
|
|
|
Oil and gas sales |
|
$ 15,785,784 |
|
$ 5,956,731 |
|
$ 973,646 |
|
|
|
|
|
|
|
|
|
Expenses: |
|
|
|
|
|
|
|
Oil and gas operating(1) |
|
2,272,251 |
|
875,319 |
|
406,361 |
|
Depletion |
|
2,006,834 |
|
1,167,235 |
|
229,406 |
|
Depreciation and amortization |
|
170,610 |
|
133,148 |
|
66,451 |
|
Accretion |
|
173,519 |
|
5,602 |
|
- |
|
General and administrative |
|
10,757,727 |
|
9,724,597 |
|
4,060,962 |
|
|
|
|
|
|
|
|
|
Net Production Data: |
|
|
|
|
|
|
|
Oil (Bbls) |
|
321,933 |
|
242,522 |
|
68,755 |
|
Natural gas (Mcf) |
|
- |
|
- |
|
- |
|
Barrels of Oil equivalent (BOE) |
|
321,993 |
|
242,522 |
|
68,755 |
|
|
|
|
|
|
|
|
|
Net Sales Data(3): |
|
|
|
|
|
|
|
Oil (per Bbl) |
|
315,540 |
|
227,976 |
|
64,084 |
|
Natural gas (Mcf) |
|
|
|
- |
|
- |
|
Barrels of Oil equivalent |
|
315,540 |
|
227,976 |
|
64,084 |
|
|
|
|
|
|
|
|
|
Average Sales Price: |
|
|
|
|
|
|
|
Oil (per Bbl) |
|
50.03 |
|
26.13 |
|
15.19 |
|
Natural gas (per Mcf) |
|
- |
|
- |
|
- |
|
Equivalent price (per BOE) |
|
50.03 |
|
26.13 |
|
15.19 |
|
|
|
|
|
|
|
|
|
Expenses ($ per BOE) (3): |
|
|
|
|
|
|
|
Oil and gas operating(1) |
|
7.20 |
|
3.84 |
|
6.34 |
|
Depreciation, depletion and |
|
|
|
|
|
|
|
amortization(2) |
|
6.36 |
|
5.12 |
|
3.58 |
|
|
|
|
|
|
|
|
|
|
(1) |
Includes transportation cost, production cost and ad valorem taxes. |
|
|
(2) |
Represents depletion of oil and gas properties only. |
|
|
(3) |
We use sales volume rather than production volume for calculation of per unit cost because not all volume produced is sold during the period. The related production costs were expensed only for the units sold, not produced based on a matching principle of accounting. Therefore, oil and gas operating expense per BOE was calculated by dividing oil and gas operating expenses for the year by the volume of oil sold during the year. |
Year ended March 31, 2007, compared to the year ended March 31, 2006.
Revenue and Production
The following table summarizes production volumes, average sales prices and operating revenue for our oil and natural gas operations for the year ended March 31, 2007 and the year ended March 31, 2006.
34
|
|
|
Year ended to the year ended March 31, 2006 |
||||||
|
|
|
For the year |
|
For the year |
$ |
|
% |
|
|
|
|
ended |
|
ended |
Increase |
|
Increase |
|
|
|
|
March 31, 2007 |
|
March 31, 2006 |
|
(Decrease) |
|
(Decrease) |
|
|
|
|
|
|
|
|
|
|
|
Production volumes: |
|
|
|
|
|
|
|
|
|
Natural gas (Mcf) |
|
- |
|
- |
- |
|
- |
|
|
Natural gas liquids (Bbls) |
|
- |
|
- |
- |
|
- |
|
|
Oil and condensate (Bbls) |
|
321,993 |
|
242,522 |
79,471 |
|
33% |
|
|
Barrels of Oil equivalent (BOE) |
|
321,993 |
|
242,522 |
79,471 |
|
33% |
|
|
|
|
|
|
|
|
|
|
|
|
Sales volumes: |
|
|
|
|
|
|
|
|
|
Natural gas (Mcf) |
|
- |
|
- |
- |
|
- |
|
|
Natural gas liquids (Bbls) |
|
- |
|
- |
- |
|
- |
|
|
Oil and condensate (Bbls) |
|
315,540 |
|
227,976 |
87,564 |
|
38% |
|
|
Barrels of Oil equivalent (BOE) |
|
315,540 |
|
227,976 |
87,564 |
|
38% |
|
|
|
|
|
|
|
|
|
|
|
|
Average Sales Price (1) |
|
|
|
|
|
|
|
|
|
Natural gas ($ per Mcf) |
|
- |
|
- |
- |
|
- |
|
|
Natural gas liquids ($ per Bbl) |
|
- |
|
- |
- |
|
- |
|
|
Oil and condensate ($ per Bbl) |
|
$ 50.03 |
|
$ 26.13 |
$ 23.90 |
|
91% |
|
|
Barrels of Oil equivalent ($ per BOE) |
|
$ 50.03 |
|
$ 26.13 |
$ 23.90 |
|
91% |
|
|
|
|
|
|
|
|
|
|
|
|
Operating Revenue: |
|
|
|
|
|
|
|
|
|
Natural gas |
|
- |
|
- |
- |
|
- |
|
|
Natural gas liquids |
|
- |
|
- |
- |
|
- |
|
|
Oil and condensate |
|
$ 15,785,784 |
|
$ 5,956,731 |
$ 9,829,053 |
|
165% |
|
|
Gain on hedging and derivatives(2) |
|
- |
|
- |
|
- |
|
- |
(1) At times, we may produce more barrels than we sell in a given period. The average sales price is calculated based on the average sales price per barrel sold, not per barrel produced.
(2) We did not engage in hedging transactions, including derivatives during the year ended March 31, 2007, or the year ended March 31, 2006.
Revenues. We generate revenue under our contract from the sale of oil recovered during test production. During the year ended March 31, 2007 our oil production increased 33% compared to the year ended March 31, 2006. This significant increase in production is primarily attributable the fact that we had two additional wells in testing or test production during the current fiscal year compared to prior fiscal year.
During the year ended March 31, 2007 we realized revenue from oil sales of $15,785,784 compared to $5,956,731 during the year ended March 31, 2006. The largest contributing factor to the 165% increase in revenue was a 91% increase in the price per barrel we received for oil sales and a 33% increase in production during the year ended March 31, 2007 compared to the fiscal year ended March 31, 2006. During the fiscal year ended March 31, 2007 we exported our oil to the world markets and realized the world market price for those sales. By comparison, during the fiscal year ended March 31, 2006 73% of oil sales were to the domestic market in Kazakhstan, where the price per barrel of oil is significantly lower than the world market price. We anticipate production to increase in upcoming years as we complete more wells. We plan to continue our drilling activities. We also hope to continue to be granted export quotas, which allow us to realize world market prices. This should continue to lead to increased revenue from oil sales.
35
As discussed above, our revenue is sensitive to changes in prices received for our oil. Our production is currently being sold at the prevailing world market price, which fluctuates in response to many factors that are outside our control. Imbalances in the supply and demand for oil can have a dramatic effect on the prices we receive for our production. Similarly, if we were denied an export quota and were forced to sell our production to the domestic market in Kazakhstan, we anticipate the price we would receive per barrel of oil would be much lower than the price we currently realize. Political instability, the economy, weather and other factors outside our control could have an impact on both supply and demand.
Costs and Operating Expenses
The following table presents details of our expenses for the year ended March 31, 2007 and 2006:
|
|
|
For the year ended March 31, 2007 |
|
For the year ended March 31, 2006 |
|
Expenses: |
|
|
|
|
|
Oil and gas operating(1) |
|
$ 2,272,251 |
|
$ 875,319 |
|
General and administrative |
|
10,757,727 |
|
9,724,597 |
|
Depletion |
|
2,006,834 |
|
1,167,235 |
|
Accretion expenses |
|
173,519 |
|
5,602 |
|
Amortization and depreciation |
|
170,610 |
|
133,148 |
|
Total |
|
$ 15,380,941 |
|
$ 11,905,901 |
|
Expenses ($ per BOE): |
|
|
|
|
|
Oil and gas operating(1) |
|
7.20 |
|
3.84 |
|
Depletion (2) |
|
6.36 |
|
5.12 |
|
|
|
|
|
|
(1) Includes transportation cost, production cost and ad valorem taxes.
(2) Represents depletion of oil and gas properties only.
Oil and Gas Operating Expenses. During the year ended March 31, 2007 we incurred $2,272,251 in oil and gas operating expenses compared to $875,319 during the year ended March 31, 2006. This significant increase is primarily the result of several factors, including increased royalty, salary and transportation expenses and increased repair costs.
During the year ended March 31, 2007 royalty paid to Government increased by $192,133 or 127% compared to the year ended March 31, 2006. The primary reason for the increase in royalty is two-fold. During the 2007 fiscal year, oil production increased 33% and our average sales price per barrel increased 91% as a result of exporting all of our oil to the world markets during fiscal 2007. While royalty expenses increased significantly, as a percentage of total revenue royalty expense remained nearly unchanged. We anticipate that royalty expenses will continue to fluctuate in proportion to production volume and realized sales price.
While oil and gas operating expenses increased 160% during the 2007 fiscal year, expense per BOE increased only 88%. We calculate oil and gas operating expense per BOE based on the volume of oil actually sold rather than production volume because not all volume produced during the period is sold during the period. The related production costs are expensed only for the units sold, not produced.
Oil and gas operating expense per BOE increased at a smaller rate because our sales volume increased fiscal 2007. In fiscal 2007, we sold 315,540 barrels of oil, while oil and gas operating expenses were $2,272,251. In
36
fiscal 2006, we sold 227,976 barrels of oil, while oil and gas operating expenses were $875,319. As expense per BOE is a function of total expense divided by the number of barrels of oil sold, the 38% increase in sales volume helped to offset the increase in gas and oil operating expenses per BOE.
Salary expenses increased by 306,406 or 152% in fiscal 2007 compared to fiscal 2006. Salary expenses increased as a result of increased payroll for Emir Oil employees, the hiring of more production and (well) maintenance personnel resulting from the two additional wells we had in testing or test production during fiscal 2007. We anticipate that salary expenses will increase consistently with the increase in number of wells.
Transportation expenses increased $775,505 or 162%. Transportation increased because of the increased production volume and as a result of production at the Kariman-1 and Kariman-2 wells, which are located farther away from the oil base than our other existing wells. We anticipate transportation expenses will increase as production increases.
During fiscal 2007, we incurred $168,693 in repair expenses at the oil storage facility. By comparison, during fiscal 2006 we incurred $45,805 in repairs. We do not expect the repair expenses will increase significantly in the future
We calculate oil and gas operating expense per BOE based on the volume of oil actually sold rather than production volume because not all volume produced during the period is sold during the period. The related production costs are expensed only for the units sold, not produced.
While oil and gas operating expenses increased 160% during fiscal 2007 compared to fiscal 2006, expense per BOE increased only 88% from $3.84 per BOE in fiscal year 2006 to $7.20 in fiscal year 2007. The reason expense per BOE increased at a lower rate than total operating expenses is due to the fact that we increased our sales volume in fiscal 2007. In fiscal 2006, we sold 227,976 barrels of oil in fiscal 2007 we sold 315,540 barrels of oil. As expense per BOE is a function of total expense divided by the number of barrels of oil sold, the 38% increase in sales volume partially offset the 160% increase in expenses resulting in the 88% increase in oil and gas operating expense per BOE.
General and Administrative Expenses. General and administrative expenses during the year ended March 31, 2007 were $10,757,727 compared to $9,724,597 during the year ended March 31, 2006. This represents an 11% increase in general and administrative expenses. Factors contributing to the increase in general and administrative expense were a 44% increase in payroll and related costs as we hired additional administrative personnel to fulfill business needs, a 13% increase in rent expense, a 64% increase in taxes resulting from increased environmental payments and other obligatory payments and a 130% increase in travel and related expenses resulting from increased business travel. We do not expect general and administrative expenses to increase at such a significant rate in upcoming years.
Also, during the year ended March 31, 2007 we granted restricted stock and stock options to our directors, officers and key employees. The fair value of these restricted stock and stock option grants was recognized in our consolidated financial statements as compensation expense. The total amount of compensation expense recognized as a result of the stock and option grants was $4,134,823. During the year ended March 31, 2006 we also granted restricted stock and stock options to our directors, officers and key employees. The total amount of compensation expense recognized as a result of the restricted stock and option grants was $4,800,954.
37
Depletion. Depletion expense for the year ended March 31, 2007 increased by $839,599 compared to depletion expenses for the year ended March 31, 2006. The major reason for this increase in depletion expense is a 38% increase in sales volume in fiscal 2007 compared to fiscal 2006. The increase in depletion expense is also attributable to the fact that we drilled additional wells, continued workover on existing wells and developed additional infrastructure during fiscal 2007.
Depreciation and Amortization. Depreciation and amortization expense for the year ended March 31, 2007 increased 28% compared to the year ended March 31, 2006. The increase resulted from purchases of fixed assets during the year.
Income from Operations. During the year ended March 31, 2007 we realized income from operations of $404,843 compared to a loss from operations of $5,949,170 during the year ended March 31, 2006. This change to income from operations during fiscal 2007 is the result of the 165% increase in revenue during fiscal 2007, which increase was only partially offset by by a 29% increase in total expenses.
Other Income. During the fiscal year ended March 31, 2007 we realized total other income of $1,487,928 compared to $639,880 during the fiscal year ended March 31, 2006. This 133% increase is largely attributable to $1,055,722 increase in interest income we realized from funds we received from a private placement we completed in December 2005 and a $126,705 increase in exchange gain resulting from fluctuations of foreign currency rates against the U.S. Dollar. This income is partially offset by a $236,878 decrease in realized gain on marketable securities and $97,501 increase in other expenses. We anticipate the funds held in deposits and marketable securities will be used to fund our operations and therefore expect interest income and gains from marketable securities, both realized and unrealized, to decrease significantly in upcoming quarters.
Net Income. For all of the foregoing reasons, during the year ended March 31, 2007 we realized net income of $1,039,491 or $0.02 per share compared to a net loss of $5,344,333 or $0.15 for the year ended March 31, 2006.
Year ended March 31, 2006 compared to the ended March 31, 2005.
Revenue and Production
The following table summarizes production volumes, average sales prices and operating revenue for our oil and natural gas operations for the year ended March 31, 2006 and the year ended March 31, 2005.
38
|
|
|
Fiscal Year ended |
||||||
|
|
|
For the Fiscal |
|
For the Fiscal |
$ |
|
% |
|
|
|
|
Year ended |
|
Year ended |
(Decrease) |
|
(Decrease) |
|
|
|
|
March 31, 2006 |
|
March 31, 2005 |
|
|
|
|
|
|
|
|
|
|
|
|
|
|
|
Production volumes: |
|
|
|
|
|
|
|
|
|
Natural gas (Mcf) |
|
- |
|
- |
- |
|
- |
|
|
Natural gas liquids (Bbls) |
|
- |
|
- |
- |
|
- |
|
|
Oil and condensate (Bbls) |
|
242,522 |
|
68,755 |
173,767 |
|
253% |
|
|
Barrels of Oil equivalent (BOE) |
|
242,522 |
|
68,755 |
173,767 |
|
253% |
|
|
|
|
|
|
|
|
|
|
|
|
Sales volumes: |
|
|
|
|
|
|
|
|
|
Natural gas (Mcf) |
|
- |
|
- |
- |
|
- |
|
|
Natural gas liquids (Bbls) |
|
- |
|
- |
- |
|
- |
|
|
Oil and condensate (Bbls) |
|
227,976 |
|
64,084 |
163,892 |
|
256% |
|
|
Barrels of Oil equivalent (BOE) |
|
227,976 |
|
64,084 |
163,892 |
|
256% |
|
|
|
|
|
|
|
|
|
|
|
|
Average Sales Price(1) |
|
|
|
|
|
|
|
|
|
Natural gas ($ per Mcf) |
|
$ - |
|
$ - |
$ - |
|
- |
|
|
Natural gas liquids ($ per Bbl) |
|
$ - |
|
$ - |
$ - |
|
- |
|
|
Oil and condensate ($ per Bbl) |
|
$ 26.13 |
|
$ 15.19 |
$ 10.94 |
|
72% |
|
|
Barrels of Oil equivalent ($ per BOE) |
|
$ 26.13 |
|
$ 15.19 |
$ 10.94 |
|
72% |
|
|
|
|
|
|
|
|
|
|
|
|
Operating Revenue: |
|
|
|
|
|
|
|
|
|
Natural gas |
|
$ - |
|
$ - |
$ - |
|
- |
|
|
Natural gas liquids |
|
$ - |
|
$ - |
$ - |
|
- |
|
|
Oil and condensate |
|
$ 5,956,731 |
|
$ 973,646 |
$ 4,983,085 |
|
512% |
|
|
Gain on hedging and derivatives(2) |
|
$ - |
|
$ - |
|
$ - |
|
- |
|
|
|
|
|
|
|
|
|
|
|
|
(1) |
At times, we may produce more barrels than we sell in a given period. The average sales price is calculated based on the average sales price per barrel sold, not per barrel produced. |
|
|
(2) |
We did not engage in hedging transactions, including derivatives during the fiscal years ended March 31, 2006 and 2005. |
Revenues. During the year ended March 31, 2006, we realized revenue from oil sales of $5,956,731 compared to $973,646 during the year ended March 31, 2005. This increase in revenues is primarily the result of several factors. During the 2006 fiscal year we performed workover of re-entered wells and drilled one additional well, which led to increased test production. We performed works to perforate a productive stratum, which led to a significant flow of oil at the Dolinnoe-3 well. As a result, during the fiscal year ended March 31, 2006 the Dolinnoe-3 well accounted for 63% of our total oil production. Additionally, the price per barrel we received for oil sold increased 72% during the fiscal year ended March 31, 2006 compared to the fiscal year ended March 31, 2005. Throughout the 2006 fiscal year domestic market price increased significantly, consistent with world market prices. Additionally during fourth fiscal quarter of our 2006 fiscal year we started exporting our oil to the world markets and realized the world market price for those sales, which is considerably higher than the domestic market price in Kazakhstan.
39
Costs and Operating Expenses
The following table presents details of our expenses for the year ended March 31, 2006 and 2005:
|
|
|
For the year ended March 31, 2006 |
|
For the year ended March 31, 2005 |
|
Expenses: |
|
|
|
|
|
Oil and gas operating(1) |
|
$ 875,319 |
|
$ 406,361 |
|
General and administrative |
|
9,724,597 |
|
4,060,962 |
|
Depletion |
|
1,167,235 |
|
229,406 |
|
Accretion expenses |
|
5,602 |
|
- |
|
Amortization and depreciation |
|
133,148 |
|
66,451 |
|
Total |
|
$ 11,905,901 |
|
$ 4,763,180 |
|
Expenses ($ per BOE): |
|
|
|
|
|
Oil and gas operating(1) |
|
3.84 |
|
6.34 |
|
Depletion (2) |
|
5.12 |
|
3.58 |
|
|
|
|
|
|
|
|
(1) |
Includes transportation cost, production cost and ad valorem taxes. |
|
|
(2) |
Represents depletion of oil and gas properties only. |
Oil and Gas Operating Expenses. During the fiscal year ended March 31, 2006, we incurred $875,319 in oil and gas operating expenses compared to $406,361 during the year ended March 31, 2005. Oil and gas operatingexpenses increased due to increased production. During the year ended March 31, 2006 production volume increased by 173,767 barrels or 253% compared to the year ended March 31, 2005. Such increase led to hiring more production and maintenance personnel and a corresponding payroll increase during the year ended March 31, 2006 of 34% compared to the year ended March 31, 2005. Increased production also led to an increase in the royalty paid to the Government of 217% during the year ended March 31, 2006 compared to the year ended March 31, 2005. As discussed above, another result of increased production was a $314,406 or 151% increase in transportation expenses during the year ended March 31, 2006 compared to the year ended March 31, 2005.
Despite an overall increase in oil and gas operating expense of 115% during the 2006 fiscal year, expense per BOE declined from $6.34 per BOE in fiscal 2005 to $3.84 per BOE in 2006. We calculate oil and gas operating expense per BOE based on the volume of oil actually sold rather than production volume because not all volume produced during the period is sold during the period. The related production costs are expensed only for the units sold, not produced.
This decrease in expense per BOE produced is due to the fact that we significantly increased our sales volume in fiscal year 2006. In fiscal 2005, we sold 64,084 barrels of oil, while oil and gas operating expenses were $406,361. By contrast, in fiscal 2006, we sold 227,976 barrels of oil, while oil and gas operating expenses were $875,319. As expense per BOE is a function of total expense divided by the number of barrels of oil sold, the 256% increase in sales volume more than offset the 115% increase in expenses resulting in the 39% decrease in oil and gas operating expense per BOE.
40
General and Administrative Expenses. General and administrative expenses during the fiscal year ended March 31, 2006 were $9,724,597 compared to $4,060,962 during the year ended March 31, 2005. This represents a 139% increase in general and administrative expenses. This significant increase is attributable to a 463% increase in payroll and other compensation, a 24% increase in rent expenses and a 26% increase in professional services fees. During the year ended March 31, 2006 we granted restricted stock and stock options to our directors, officers and key employees. Fair value of stock and stock options was recognized in our consolidated financial statements as compensation expense. The total amount of compensation expense recognized as a result of the stock and option grants was $4,800,954. Additionally, during the year ended March 31, 2006 we hired more administrative personnel to operate our business, using services of technicians, engineers, accountants and lawyers, as well as incurring other general corporate expenses.
Depletion. Depletion expenses for the year ended March 31, 2006 increased by $937,829 compared to depletion expenses for the year ended March 31, 2005. The major reason for this increase in depletion expense is a 256% increase in sales volume in fiscal 2006 compared to fiscal 2005. The increase in depletion expense is also attributable to the fact that we drilled additional wells, continued workover on existing wells and developed additional infrastructure during fiscal 2006.
Depreciation and Amortization. Depreciation and amortization expenses for the year ended March 31, 2006 increased 100% compared to previous year. The increase resulted from purchases of fixed assets during the year.
Loss from Operations. As a result of significantly increasing expenses, which were only partially offset by revenue from oil sales, during the fiscal year ended March 31, 2006 we realized a loss from operations of $5,949,170 compared to a loss from operations of $3,789,534 during the fiscal year ended March 31, 2005. While we realized a 512% increase in revenue during the year ended March 31, 2006 compared to the comparable period 2005, this increase was offset by a 115% increase in oil and gas operating expenses, a 409% increase in depletion expenses and a 139% increase in general and administrative expenses. This resulted in a 57% increase in loss from operations during the fiscal year ended March 31, 2006 compared to the fiscal year ended March 31, 2005.
Other Income. During the fiscal year ended March 31, 2006 we realized total other income of $639,880 compared to $503,565 during the fiscal year ended March 31, 2005. This 27% increase in other income is largely attributable to $416,860 increase in interest income, $51,811 increase in realized gain on marketable securities and $252,767 decrease in unrealized loss on marketable securities. During the year ended March 31, 2006 we received approximately $55 million for securities sold during a private placement transaction completed in December 2005. Therefore, at times during the year, we had funds that were not being used in operations that we invested in deposits and marketable securities. This income is partially offset by a $513,068 increase in exchange loss resulting from fluctuations of foreign currency rates against the U.S. Dollar and a $72,055 increase in other expenses.
Net Loss. During the fiscal year ended March 31, 2006 we realized a net loss of $5,344,333 compared to a net loss of $3,286,312 during the fiscal year ended March 31, 2005. Notwithstanding the significant increase in revenue resulting from increased oil production during the year ended March 31, 2006 net loss increased significantly. This significant increase in net loss is largely attributable to 139% increase in general and administrative expenses.
41
During the year ended March 31, 2006 our general and administrative expenses increased by $5,663,635 compared to the year ended March 31, 2005.
Liquidity and Capital Resources
Funding for our activities has historically been provided by funds raised through the sale of our common stock. From inception on May 6, 2003 through March 31, 2007 we have raised $94,626,926 through the sale of our common stock. As of March 31, 2007 we had cash and cash equivalents on hand of $12,172,940.
Our need for capital is primarily to fund our ongoing operations to meet the drilling requirements of our minimum work program. For the period from inception on May 6, 2003 through March 31, 2007, we have incurred capital expenditures of $104,187,568 for exploration, development and acquisition activities.
We continually evaluate our capital needs and compare them to our capital resources. We project we will need up to an additional $125 million to complete exploration of our properties in order to secure a commercial production contract over our entire exploration contract territory. We anticipate that required financial resources will be derived from our current and future production revenues and a combination of commercial debt and the issuance of corporate debt and/or equity securities.
In the event we are unable to obtain sufficient funding to fully explore our entire exploration contract territory, we will forego exploration of one or more of the potential structures within the Extended Territory. The failure to explore a structure by the end of our exploration contract would terminate our rights to explore the structure in the future and would preclude us from making application for a commercial production contract for the structure.
One of the challenging tasks we have faced is how to make accurate production forecasts during the exploration stage. There are many factors that contribute to the complexity of reliable forecasting by an exploration stage company. Our first challenge has been to secure qualified drilling subcontractors and to obtain timely performance. The current energy boom in Kazakhstan has created considerable competition for good rigs and qualified labor. This has led to delays in rig delivery and increased cost and demand for qualified labor.
Second, we are in continuous test production on each well. We are required by law to test each interval using different choke sizes. The minimum testing periods usually extend over a period of months. There is considerable down time while equipment is being put in place and removed during this process. In addition, we have experimented with various reworking methodologies attempting to determine the best methods to suit the characteristics of the oil, gas and pressure variations encountered in each structure.
Our monthly production figures have remained steadily within a range of our expectations, and at our current levels of oil production we are operating above the break-even point, exclusive of our drilling program expenditures. If our operations are to generate a material portion of the future capital needed to complete our exploration contract, then our monthly production will have to increase significantly. In addition to our efforts to increase revenue from oil sales to help fund our drilling program expenditures, we are also negotiating with interested banks to secure a credit facility that will allow us to continue our exploration contract drilling obligations without delay.
42
Cash Flows
During the year ended March 31, 2007 cash was primarily used to fund exploration and development expenditures. See below for additional discussion and analysis of cash flow.
|
|
Year ended |
|
Year ended |
|
Year ended |
|
|
|
|
|
|
|
|
Net cash used in operating activities |
$ (1,877,144) |
|
$ (1,623,829) |
|
$ (3,505,219) |
|
Net cash used in investing activities |
$ (42,850,150) |
|
$ (18,421,553) |
|
$ (18,001,879) |
|
Net cash provided by financing activities |
$ 5,758,502 |
|
$ 60,408,561 |
|
$ 27,280,160 |
|
|
|
|
|
|
|
|
NET CHANGE IN CASH AND |
$ (38,968,792) |
|
$ 40,363,179 |
|
$ 5,773,062 |
|
|
|
|
|
|
|
Our principal source of liquidity during the year ended March 31, 2007 was cash and cash equivalents. At March 31, 2006 cash and cash equivalents totaled approximately $51 million. At March 31, 2007 cash and cash equivalents had decreased approximately $38.9 million as we used cash to fund operations. As discussed above, during the year ended March 31, 2007 we spent approximately $37 million to fund the most active period of drilling and development activities in our history.
While we anticipate revenue to increase in upcoming quarters as new wells are completed and put into test production, at this time we cannot predict how much our production, and correspondingly, our revenue might increase. At current production rates, we expect to be able to secure additional financing through debt financing or a combination of debt and equity financing. These funds will be used to drill the additional wells we need to support our claims of commercially producible reserves by the end of the term of our exploration contract. At this time, we are negotiating with one of the financial institution to provide us additional financing. We expect that we finalize our negotiations within the first quarter of fiscal 2008 and will be able to secure additional funding on acceptable terms. If we are unable to secure financing within that time frame, we will likely be forced to significantly curtail our exploration, drilling and development activities until such time as additional funding can be obtained. We currently have no firm commitment from any party to provide us with financing. Moreover, even if we are able to finalize the aforementioned negotiations and obtain financing within the first fiscal quarter of 2008, we expect the amount of the financing will be insufficient to fund our operations to the end of exploration stage and we therefore may need to seek additional financing in the future to fund further exploration stage activities.
Certain operating cash flows are denominated in Kazakh tenge and are translated into U.S. dollars at the exchange rate in effect at the time of the transaction. Because of the potential for civil unrest, war and asset expropriation, some or all of these matters, which impact operating cash flow, may affect our ability to meet our short-term cash needs.
Contractual Obligations and Contingencies
The following table lists our significant commitments at March 31, 2007, excluding current liabilities as listed on our consolidated balance sheet:
43
|
|
|
Payments Due By Period |
||||||||
|
Contractual obligations |
|
Total |
|
Less than 1 year |
|
1-3 years |
|
4-5 years |
|
After 5 years |
|
Capital
Expenditure |
|
$ 21,250,000 |
|
$12,700,000 |
|
$ 8,550,000 |
|
- |
|
- |
|
Due to the Government
of |
|
$ 11,344,880 |
|
- |
|
$11,344,880 |
|
- |
|
- |
|
Liquidation Fund |
|
$ 2,165,829 |
|
- |
|
$ 2,165,829 |
|
- |
|
- |
|
Total |
|
$ 34,760,709 |
|
$12,700,000 |
|
$22,060,709 |
|
- |
|
- |
(1) Under the terms of its subsurface exploration contract, Emir Oil LLP is required to spend a total of $48.7 million in exploration and development activities on the ADE Block. To retain its rights under the contract, the Company must spend a minimum of $12.7 million in 2007, $8.5 million in 2008 and $70 thousand in 2009. If we fail to do so, we may be subject to the loss of our exploration license.
(2) In connection with our acquisition of the oil and gas contract covering the ADE Block and the Extended Territory, we are required to repay the ROK for historical costs incurred by it in undertaking geological and geophysical studies and infrastructure improvements. The repayment terms of this obligation will not be determined until such time as we apply for and are granted commercial production rights by the ROK. Under our contract, if we wish to commence commercial production, we must apply for such right prior to the expiration of our exploration and development rights in July 2009. The ROK is required to conduct the negotiations under the Law of Petroleum in Kazakhstan. Although we can apply for commercial production rights at any time, we enjoy certain benefits under our contract that currently make it more economically advantageous for us to continue exploration and development activities at this time. Should we decide not to pursue a commercial production contract, we can relinquish the ADE Block and Extended Territory to the ROK in satisfaction of this obligation. Our repayment obligation for the ADE Block is $5,994,200. Our repayment obligation for the Extended Territory is $5,350,680.
Off-Balance Sheet Financing Arrangements
As of March 31, 2007, we had no off-balance sheet financing arrangements.
Critical Accounting Policies
We have identified the accounting policies below as critical to our business operations and the understanding of our financial statements. The impact of these policies and associated risks are discussed throughout Management’s Discussion and Analysis and Plan of Operations where such policies affect our reported and expected financial results. A complete discussion of our accounting policies is included in Note 2 of the Notes to Consolidated Financial Statements.
Foreign Exchange Transactions
Transactions denominated in foreign currencies are reported at the rates of exchange prevailing at the date of the transaction. Monetary assets and liabilities denominated in foreign currencies are translated to U.S. dollar at the rates of exchange prevailing at the balance sheet dates. Any gains or losses arising from a change in exchange rates subsequent to the date of the transaction are included as an exchange gain or loss in the Consolidated Statements of Operations.
Share-Based Compensation
The Company accounts for options granted to non-employees at their fair value in accordance with SFAS No. 123R, Share Based Payment and EITF Abstracts Issue 96-18, Accounting for Equity Instruments That Are Issued to Other Than Employees for Acquiring, or in Conjunction with Selling, Goods or Services. Under
44
SFAS No. 123R, share-based compensation is determined as the fair value of the equity instruments issued. The measurement date for these issuances is the earlier of the date at which a commitment for performance by the recipient to earn the equity instruments is reached or the date at which the recipient’s performance is complete. Stock options granted to the “selling agents” in the private equity placement transactions have been offset to the proceeds as a cost of capital. Stock options and stocks granted to other non-employees are recognized in the Consolidated Statements of Operations.
The Company has a stock option plan as described in Note 13. Compensation expense for options and stocks granted to employees is determined based on their fair values at the time of grant, the cost of which is recognized in the Consolidated Statements of Operations over the vesting periods of the respective options.
Full Cost Method of Accounting
We follow the full cost method of accounting for our costs of acquisition, exploration and development of oil and gas properties.
Under full cost accounting rules, the net capitalized costs of evaluated oil and gas properties shall not exceed an amount equal to the present value of future net cash flows from estimated production of proved oil and gas reserves, based on current economic and operating conditions, including the use of oil and gas prices as of the end of the period.
Given the volatility of oil and gas prices, it is reasonably possible that the estimate of discounted future net cash flows from proved oil and gas reserves could change. If oil and gas prices decline, even if only for a short period of time, it is possible that impairments of oil and gas properties could occur. In addition, it is reasonably possible that impairments could occur if costs are incurred in excess of any increases in the cost ceiling, revisions to proved oil and gas reserves occur, or if properties are sold for proceeds less than the discounted present value of the related proved oil and gas reserves.
All geological and geophysical studies, with respect to our licensed territory have been capitalized as part of the oil and gas properties.
Our oil and gas properties primarily include the value of the license and other capitalized costs.
Depletion of producing properties is computed using the unit-of-production method based on estimated proved reserves.
Ceiling test
The capitalized oil and gas properties are subject to a “ceiling test.” The full cost ceiling test is an impairment test prescribed by SEC Regulation S-X Rule 4-10. The test determines a limit, or ceiling, on the book value of oil and gas properties. That limit is basically the after tax present value of the future net cash flows from proved crude oil and natural gas reserves. This ceiling is compared to the net book value of the oil and gas properties reduced by any related deferred income tax liability. If the net book value reduced by the related deferred income taxes exceeds the ceiling, impairment or non-cash write down is required. Ceiling test impairment can give the Company a significant loss for a particular period; however, future depletion expense would be reduced.
45
Recently Issued Accounting Pronouncements
In June 2006, the FASB issued FASB Interpretation No. 48 “Accounting for Uncertainty in Income Taxes, an interpretation of FASB Statement No. 109”. This interpretation clarifies the accounting for uncertainty in income taxes recognized in an enterprise’s financial statements in accordance with FASB No. 109 “Accounting for Income taxes”. This interpretation is effective for the fiscal years beginning after December 15, 2006. Management does not anticipate this Statement will impact our consolidated financial position or consolidated results of operations and cash flows.
In September 2006, the FASB issued Statement No. 157, “Fair Value Measurements” This Statement defines fair value, establishes a framework for measuring fair value in generally accepted accounting principles (GAAP), and expands disclosures about fair value measurements. This Statement applies under other accounting pronouncements that require or permit fair value measurements, the Board having previously concluded in those accounting pronouncements that fair value is the relevant measurement attribute. This Statement is effective for financial statements issued for the fiscal years beginning after November 15, 2007. Management does not anticipate this Statement will impact our consolidated financial position or consolidated results of operations and cash flows.
In September 2006, the FASB issued Statement No. 158, “Employers’ Accounting for Defined Benefit Pension and Other Postretirement Plans”, an amendment of FASB Statements No. 87, 88, 106, and 132(R). This Statement improves financial reporting by requiring an employer to recognize the overfunded or underfunded status of a defined benefit postretirement plan (other than a multiemployer plan) as an asset or liability in its statement of financial position and to recognize changes in that funded status in the year in which the changes occur through comprehensive income of a business entity or changes in unrestricted net assets of a not-for-profit organization. This Statement is effective for employers with publicly traded equity securities is required to initially recognize the funded status of a defined benefit postretirement plan and to provide the required disclosures as of the end of the fiscal year ending after December 15, 2006. Management belives this Statement has no material impact the Company’s consolidated financial position or consolidated results of operations and cash flows.
In September 2006, the SEC staff issued Staff Accounting Bulletin (SAB) Topic 1N, “Financial Statements - Considering the Effects of Prior Year Misstatements when Quantifying Misstatements in Current Year Financial Statements” ( SAB 108). The SEC staff is providing guidance on how prior year misstatements should be taken into consideration when quantifying misstatements in current year financial statements for purposes of determining whether the current year’s financial statements are materially misstated and should be restated. SAB 108 is effective for fiscal years ending after November 15, 2006. We do not believe SAB 108 has a material impact on its results of operations, financial condition and cash flows.
In September 2006, the EITF issued EITF Abstracts Issue No. 06-3 (EITF 06-3). The EITF is providing guidance on how taxes collected from customers and remitted to Governmental Authorities should be presented in the income statements. EITF 06-3 is effective for interim and annual periods beginning after December 15, 2006. We do not anticipate EITF 06-3 will have a material impact on its results of operations, financial condition and cash flows.
47
In February 2007, the FASB issued Statement No. 159, “The Fair Value Option for Financial Assets and Financial Liabilities—Including an amendment of FASB Statement No. 115”. This Statement permits entities to choose to measure many financial instruments and certain other items at fair value. The objective is to improve financial reporting by providing entities with the opportunity to mitigate volatility in reported earnings caused by measuring related assets and liabilities differently without having to apply complex hedge accounting provisions. This Statement is expected to expand the use of fair value measurement, which is consistent with the Board’s long-term measurement objectives for accounting for financial instruments. This Statement is effective for financial statements issued for the fiscal years beginning after November 15, 2007. Management does not anticipate this Statement will impact our consolidated financial position or consolidated results of operations and cash flows.
Effects of Inflation and Pricing
The oil and natural gas industry is very cyclical and the demand for goods and services of oil field companies, suppliers and others associated with the industry puts extreme pressure on the economic stability and pricing structure within the industry. Typically, as prices for oil and natural gas increase, so do all associated costs. Material changes in prices have an impact on the current revenue stream, estimates of future reserves, borrowing base calculations of bank loans and value of properties in purchase and sale transactions. Material changes in prices can impact the value of oil and natural gas companies and their ability to raise capital, borrow money and retain personnel. While we do not currently expect business costs to materially increase, continued high prices for oil and natural gas could result in increases in the cost of material, services and personnel.
Item 7A. Qualitative and Quantitative Disclosures About Market Risk
Our primary market risks are fluctuations in commodity prices and foreign currency exchange rates. We do not currently use derivative commodity instruments or similar financial instruments to attempt to hedge commodity price risks associated with future crude oil production.
Commodity Price Risk
Our revenues, profitability and future growth depend substantially on prevailing prices for crude oil. Prices also affect the amount of cash flow available for capital expenditures and our ability to either borrow or raise additional capital. Price affects our ability to produce crude oil economically and to transport and market our production either through export to international markets or within Kazakhstan. Our fiscal year 2007 crude oil sales in the international export market were based on prevailing market prices at the time of sale less applicable discounts due to transportation.
Historically, crude oil prices have been subject to significant volatility in response to changes in supply, market uncertainty and a variety of other factors beyond our control. Crude oil prices are likely to continue to be volatile and this volatility makes it difficult to predict future oil price movements with any certainty. Any declines in oil prices would reduce our revenues, and could also reduce the amount of oil that we can produce economically. As a result, this could have a material adverse effect on our business, financial condition and results of operations.
48
Foreign Currency Risk
Our functional currency is the U.S. dollar. Emir Oil, LLP, our Kazakhstani subsidiary, also uses the U.S. dollar as its functional currency. To the extent that business transactions in Kazakhstan are denominated in the Kazakh Tenge we are exposed to transaction gains and losses that could result from fluctuations in the U.S. Dollar—Kazakh Tenge exchange rate. We do not engage in hedging transactions to protect us from such risk.
Item 8. Financial Statements and Supplementary Data
The consolidated financial statements and supplementary data required by this item are included beginning at page F-1 herein.
Item 9. Changes in and Disagreements with Accountants on Accounting and Financial Disclosure
As previously reported in the Current Report on Form 8-K we filed on February 21, 2007, the audit committee of our board of directors terminated the engagement of BDO Kazakhstanaudit as the Company’s independent registered public accounting firm as of February 21, 2007. BDO Kazakhstanaudit had served as our independent registered public accounting firm since February 2004.
The audit report of BDO Kazakhstanaudit for the fiscal years ended March 31, 2006 and March 31, 2005 did not contain an adverse opinion, disclaimer of opinion or qualification or modification as to uncertainty, audit scope or accounting principles.
In connection with its audits for the past two fiscal years and review of unaudited financial statements through December 31, 2006 and through the date of dismissal there were no disagreements with BDO Kazakhstanaudit, on any matters of accounting principles or practices, financial statement disclosure, or auditing scope or procedures, which if not resolved to the satisfaction of BDO Kazakhstanaudit, would have caused them to make reference thereto in its reports on the financial statements for such years.
During the two most recent fiscal years and through February 21, 2007, there have been no reportable events (as defined in Regulation S-K, Item 304(a)(1)(v)).
On February 21, 2007, we engaged Hansen, Barnett & Maxwell, Certified Public Accountants to serve as our independent registered public accounting firm. During the two most recent fiscal years and through February 21, 2007, we had not consulted with Hansen, Barnett & Maxwell, P.C. regarding (i) the application of accounting principles to a specified transaction, either completed or proposed, or the type of audit opinion that might be rendered on our financial statements, and no written report or oral advice was provided to us by Hansen, Barnett and Maxwell, P.C. that was an important factor considered by our audit committee in reaching a decision as to an accounting, auditing or financial reporting issue; or (ii) any matter that was either the subject of a disagreement (within the meaning of Instruction 4 of Item 304 of Regulations S-K), or a reportable event (as that term is defined in Item 304(a)(1)(v) of Regulation S-K.)
49
Item 9A. Controls and Procedures
Evaluation of Disclosure Controls and Procedures
We maintain disclosure controls and procedures, as such term is defined in Rules 13a-15(e) and 15d-15(e) under the Securities Exchange Act of 1934, as amended (the “Exchange Act”), that are designed to provide reasonable assurance that information required to be disclosed by us in the reports that we file or submit under the Exchange Act is recorded, processed, summarized and reported within the time periods specified in the SEC rules and forms, and that such information is accumulated and communicated to our management, including our principal executive officer and principal financial officer, as appropriate, to allow timely decisions regarding required financial disclosures. Because of inherent limitations, our disclosure controls and procedures, no matter how well designed and operated, can provide only reasonable, and not absolute, assurance that the objectives of such disclosure controls and procedures are met.
As of the end of the period covered by this Report we conducted an evaluation, under the supervision and with the participation of our management, including our principal executive officer and principal financial officer, of the effectiveness of the design and operation of our disclosure controls and procedures pursuant to Exchange Act Rules 13a-15(b) and 15d-15(b). Based on this evaluation, our principal executive officer and principal financial officer concluded that our disclosure controls and procedures were effective as of March 31, 2007.
Management’s Report on Internal Control Over Financial Reporting
Our management is responsible for establishing and maintaining adequate internal control over financial reporting, as such term is defined in Exchange Act Rules 13a-15(f) and 15d-15(f). Our internal control over financial reporting is a process designed to provide reasonable assurance regarding the reliability of financial reporting and the preparation of the financial statements for external purposes in accordance with generally accepted accounting principles. Because of its inherent limitations, internal control over financial reporting may not prevent or detect misstatements. Also, projections of any evaluation of effectiveness to future periods are subject to the risk that internal controls may become inadequate because of changes in conditions, or that the degree of compliance with policies and procedures may deteriorate.
Under the supervision and with the participation of our management, including our principal executive officer and principal financial officer, we conducted an evaluation of the effectiveness of our internal control over financial reporting based on the framework set forth in Internal Control—Integrated Framework issued by the Committee of Sponsoring Organizations of the Treadway Commission. Based on our evaluation under the framework in Internal Control — Integrated Framework, our management concluded that our internal control over financial reporting was effective as of March 31, 2007.
Hansen, Barnett & Maxwell, P.C. the independent registered public accounting firm that audited the consolidated financial statements included in this Annual Report on Form 10-K, has also audited management’s assessment of our internal control over financial reporting and the effectiveness of our internal control over financial reporting as of March 31, 2007, as stated in their report which is included herein.
Changes in Internal Control over Financial Reporting
There were no changes in our internal controls over financial reporting during the quarter ended March 31, 2007 that materially affected, or are reasonably likely to materially affect, our internal control over financial reporting.
50
HANSEN, BARNETT & MAXWELL, P.C.
|
|
Registered with the Public Company |
|
|
Accounting Oversight Board |
|
|
|

|
|
A Professional Corporation |
|
|
CERTIFIED PUBLIC ACCOUNTANTS |
|
|
AND |
|
|
BUSINESS CONSULTANTS |
|
|
5 Triad Center, Suite 750 |
|
|
Salt Lake City, UT 84180-1128 |
|
|
Phone: (801) 532-2200 |
|
|
Fax: (801) 532-7944 |
|
|
www.hbmcpas.com |
REPORT OF INDEPENDENT REGISTERED PUBLIC ACCOUNTING FIRM
To the Board of Directors and Stockholders
BMB Munai, Inc.
We have audited management’s assessment, included in the accompanying Management’s Annual Report on Internal Control Over Financial Reporting, that BMB Munai, Inc. and subsidiary maintained effective internal control over financial reporting as of March 31, 2007, based on criteria established in Internal Control—Integrated Framework issued by the Committee of Sponsoring Organizations of the Treadway Commission (the COSO criteria). BMB Munai, Inc.’s management is responsible for maintaining effective internal control over financial reporting and for its assessment of the effectiveness of internal control over financial reporting. Our responsibility is to express an opinion on management’s assessment and an opinion on the effectiveness of the company’s internal control over financial reporting based on our audit.
We conducted our audit in accordance with the standards of the Public Company Accounting Oversight Board (United States). Those standards require that we plan and perform the audit to obtain reasonable assurance about whether effective internal control over financial reporting was maintained in all material respects. Our audit included obtaining an understanding of internal control over financial reporting, evaluating management’s assessment, testing and evaluating the design and operating effectiveness of internal control, and performing such other procedures as we considered necessary in the circumstances. We believe that our audit provides a reasonable basis for our opinion.
A company’s internal control over financial reporting is a process designed to provide reasonable assurance regarding the reliability of financial reporting and the preparation of financial statements for external purposes in accordance with generally accepted accounting principles. A company’s internal control over financial reporting includes those policies and procedures that (1) pertain to the maintenance of records that, in reasonable detail, accurately and fairly reflect the transactions and dispositions of the assets of the company; (2) provide reasonable assurance that transactions are recorded as necessary to permit preparation of financial statements in accordance with generally accepted accounting principles, and that receipts and expenditures of the company are being made only in accordance with authorizations of management and directors of the company; and (3) provide reasonable assurance regarding prevention or timely detection of unauthorized acquisition, use, or disposition of the company’s assets that could have a material effect on the financial statements.
Because of its inherent limitations, internal control over financial reporting may not prevent or detect misstatements. Also, projections of any evaluation of effectiveness to future periods are subject to the risk that controls may become inadequate because of changes in conditions, or that the degree of compliance with the policies or procedures may deteriorate.
51
In our opinion, management’s assessment that BMB Munai, Inc. and subsidiary maintained effective internal control over financial reporting as of March 31, 2007 is fairly stated, in all material respects, based on the COSO criteria. Also, in our opinion, BMB Munai, Inc. and subsidiary maintained, in all material respects, effective internal control over financial reporting as of March 31, 2007, based on the COSO criteria.
We have also audited, in accordance with the standards of the Public Company Accounting Oversight Board (United States), the consolidated balance sheets of BMB Munai, Inc. as of March 31, 2007 and the related consolidated statements of operations, shareholders’ equity and cash flows for the period ended March 31, 2007 of BMB Munai, Inc. and our report dated June 13, 2007 expressed an unqualified opinion thereon.
/s/ HANSEN, BARNETT & MAXWELL, P.C.
Salt Lake City, Utah
June 13, 2007
52
Item 9B. Other Information
|
|
None. |
PART III
Item 10. Directors, Executive Officers and Corporate Governance
The following table sets forth certain information as of June 7, 2007 regarding the members of our board of directors and executive officers, including their ages, and all offices and positions held within the Company. Directors are elected for a period of three years and thereafter serve until their successor is duly elected by the stockholders and qualified. Officers and other employees serve at the will of the Board of Directors.
|
Name |
Age |
Positions with BMB |
Director Since |
|
Boris Cherdabayev |
52 |
Chairman of the Board of Directors |
November 2003 |
|
|
and Chief Executive Officer |
|
Askar Tashtitov |
27 |
President |
|
Sanat Kasymov |
30 |
Chief Financial Officer |
|
Gamal Kulumbetov |
31 |
Chief Operating Officer |
|
Troy Nilson |
40 |
Director |
December 2004 |
|
Stephen Smoot |
50 |
Director |
January 2005 |
|
Valery Tolkachev |
37 |
Director |
December 2003 |
|
Leonard M. Stillman Jr. |
64 |
Director |
October 2006 |
A brief description of the background and business experience of each of the above listed individuals follows:
Boris Cherdabayev. Mr. Cherdabayev joined BMB Holding, Inc., and assumed his current positions in May 2003. From May 2000 to May 2003, Mr. Cherdabayev served as Director at LLP TengizChevroil, LLP a multinational oil and gas company owned by Chevron, ExxonMobil, KazMunayGas and LukOil. From 1998 to May 2000, Mr. Cherdabayev served as a member of the Board of Directors, Vice-President of Exploration and Production and Executive Director on Services Projects Development for NOC “Kazakhoil”, an oil and gas exploration and production company. From 1983 to 1988, and from 1994 to 1998 he served as a people’s representative at Novouzen City Council (Kazakhstan); he served as a people’s representative at Mangistau Oblast Maslikhat (regional level legislative structure) and a Chairman of the Committee on Law and Order. For his achievements Mr. Cherdabayev has been awarded with a national “Kurmet” order. Mr. Cherdabayev earned an engineering degree from the Ufa Oil & Gas Institute, with a specialization in “machinery and equipment of oil and gas fields” in 1976. Mr. Cherdabayev also earned an engineering degree from Kazakh Polytechnic Institute, with a specialization in “mining engineer on oil and gas fields’ development.” During his career he also completed an English language program in the USA, the CHAMP Program (Chevron Advanced Management Program) at Chevron Corporation offices in San-Francisco, CA, USA, and the CSEP Program (Columbia Senior Executive Program) at Columbia University, New York, NY USA. Mr. Cherdabayev is not a director or nominee of any other reporting company.
53
Askar Tashtitov. Mr. Tashtitov has been with the Company since 2004, serving in the capacity of financial analyst. Prior to joining the Company, from 2002 to 2004, Mr. Tashtitov was employed by PA Government Services, Inc. Mr. Tashtitov worked as a management consultant specializing in oil and gas projects. In May 2002, Mr. Tashtitov earned a Bachelor of Arts degree from Yale University majoring in Economics and History. Mr. Tashtitov passed the AICPA Uniform CPA Examination in August, 2006. Mr. Tashtitov is not a director or nominee of any reporting company.
Sanat Kasymov. Mr. Kasymov graduated from Istanbul University of Istanbul, Turkey in 1998 where he was awarded a Bachelors degree in Economics with an emphasis in International Relations. In 2003, Mr. Kasymov passed the AICPA Uniform CPA Examination. From April 1999 through December 2001 Mr. Kasymov was employed as the Chief Specialist of the Corporate Relations Department of Demir Kazakhstan Bank. From December of 2001 through 2004 Mr. Kasymov was employed at Deloitte & Touche as a Senior Auditor where he became proficient in the application of both international and national accounting (IAS/ US GAAP) and auditing standards (ISA/ US GAAS). From February 2005 to January 2006, when he was appointed as the Company’s Chief Financial Officer, Mr. Kasymov served as the Financial Manager of BMB Munai, Inc. Mr. Kasymov is not a director or nominee of any reporting company.
Gamal Kulumbetov. Mr. Kulumbetov graduated from the Kazakh National Technical University, Department of Oil and Gas Geology located in Almaty, Kazakhstan in 1997 where he was awarded a Bachelors degree in Geology. Mr. Kulumbetov is now in the process of completing a Ph.D. from the same university. Since graduating in 1997 Mr. Kulumbetov has completed various oil and gas and geological trainings from Japan National Oil Corporation, MI Drilling Fluids LLC of Germany, Chevron Texaco of Houston, Petroleum Industry Training Center of Almaty, Kazakhstan, and Ernst & Young Company of Almaty, Kazakhstan. In 2000 Mr. Kulumbetov was employed by Halliburton as a Surface Data Logging Engineer. From 2001 through April 2005 Mr. Kulumbetov was employed by LLP TengizChevroil (“TCO”) as the Deputy Manager of the TCO Fields Development Project. From April 2005 to December 2005 Mr. Kulumbetov was employed at Big Sky Energy Corporation as Chief Geologist. Mr. Kulumbetov joined BMB Munai, Inc. as a Vice President of Operations in December of 2005. Mr. Kulumbetov is not a director or nominee of any reporting company.
Troy F. Nilson, CPA. Since February 2001, Mr. Nilson has served as an Audit Partner with Chisholm, Bierwolf & Nilson, Certified Public Accountants, in Bountiful, Utah. From December 2000 to February 2001, he served as an Audit Manager for Crouch, Bierwolf & Associates, Certified Public Accountants, in Salt Lake City, Utah. Prior to that time, Mr. Nilson served as the Senior Auditor for Intermountain Power Agency in Salt Lake City, Utah from March 1995 to December 2000. In the past five years, Mr. Nilson has had extensive public and private company audit, audit review and Securities and Exchange Commission disclosure and reporting experience. Mr. Nilson received licensure as a Certified Public Accountant in 1997. Mr. Nilson earned a Masters of Science Degree in Business Information Systems from Utah State University in December 1992, and a Bachelor of Science in Accounting from Utah State University in August 1990. Mr. Nilson is not a director or nominee of any other reporting company.
54
Stephen Smoot. During the past five years Mr. Smoot has been self-employed as a consultant in the area of foreign technology development and transfer. Mr. Smoot assisted in forming Caspian Service Group Limited, a wholly-owned subsidiary of Caspian Services, Inc., formerly EMPS Corporation, in December 1999, and served as President of Caspian Services from inception until February 2002. Mr. Smoot served as the Interim President of EMPS Corporation from June 2004 until December 2004. Mr. Smoot is not a director or nominee of any other reporting company.
Valery Tolkachev. Since 1999, Mr. Tolkachev has been employed with Aton Investment Company in Moscow, Russia, where he currently serves as the Managing Director, Capital Markets. From 1991 to 1999, Mr. Tolkachev served in various positions with various employers including, MDM Bank, InkomBank, InkomCapital and others. Mr. Tolkachev graduated with Honors from the High Military School in Kiev, USSR in 1989. In 2005 he completed his studies at the Academy of National Economy, as a qualified lawyer. Mr. Tolkachev also serves as a director of Caspian Services, Inc., and Bekem Metals, Inc. Both are U.S. reporting companies.
Leonard M. Stillman Jr. Mr. Stillman received his Bachelor of Science in mathematics from Brigham Young University and Master of Business Administration from the University of Utah. He began his career in 1963 with Sperry UNIVAC as a programmer developing the trajectory analysis software for the Sergeant Missile system. Mr. Stillman spent many years as a designer and teacher of computer language classes at Brigham Young University, where he developed applications for the Administrative Department including the school’s first automated teacher evaluation system. During that time, he was also a Vice-President of Research and Development for Automated Industrial Data Systems, Inc and the Owner of World Data Systems Company, which provided computerized payroll services for companies such as Boise Cascade. Mr. Stillman has over 35 years of extensive business expertise including strategic planning, venture capital financing, budgeting, manufacturing planning, cost controls, personnel management, quality planning and management, and the development of standards, policies and procedures. He has extensive skills in the design and development of computer software systems and computer evaluation. Mr. Stillman is a Co-Founder of Stillman George, Inc., where he is primarily responsible for managing information, technical development and financial analysis projects and development as well as involved in general company management and consulting activities. The company consolidates a broad variety of skills from a growing group of business professionals to provide needed support in finance, marketing, management, sales, planning, product development and more to businesses worldwide. Mr. Stillman is not a director or nominee of any other reporting company.
Family Relationships
There are no family relationships among our directors and/or executive officers.
Involvement in Certain Legal Proceedings
During the past five years none of our executive officers, directors, promoters or control persons has been involved in any of the following events that could be material to an evaluation of his ability or integrity, including:
55
(1) Any bankruptcy petition filed by or against any business of which such person was a general partner or executive officer either at the time of the bankruptcy or within two years prior to that time.
(2) Any conviction in a criminal proceeding or being subject to a pending criminal proceeding (excluding traffic violations and other minor offenses);
(3) Being subject to any order, judgment, or decree, not subsequently reversed, suspended or vacated, of any court of competent jurisdiction, permanently or temporarily enjoining, barring, suspending or otherwise limiting his involvement in any type of business, securities or banking activities; and
(4) Being found by a court of competent jurisdiction (in a civil action), the Securities and Exchange Commission or the Commodity Futures Trading Commission to have violated a federal or state securities or commodities law, which judgment has not subsequently been reversed, suspended, or vacated.
Committees of the Board of Directors
Audit Committee
Our board of directors has established an audit committee, whose principal functions are to assist the board in the selection, review and oversight of our independent registered public accounting firm, the approval of all audit, review and attest services provided by the independent registered public accounting firm, the integrity of our reporting practices and the evaluation of our internal controls and accounting procedures and to resolve disagreements between management and the independent registered public accountants regarding financial reporting. The audit committee has the sole authority to retain and terminate our independent registered public accounting firm and to approve the compensation paid to our independent registered public accounting firm. The audit committee is responsible for the pre-approval of all non-audit services provided by its independent auditors. Non-audit services are only provided by our independent accountants to the extent permitted by law. The audit committee is comprised of three independent directors, Troy Nilson, Stephen Smoot and Leonard Stillman, with Mr. Nilson acting as chairman. Our board of directors has determined that Mr. Nilson qualifies as an “audit committee financial expert” under the rules of the SEC adopted pursuant to the requirements of the Sarbanes-Oxley Act of 2002. Our board of directors has also determined that Mr. Nilson, Mr. Smoot and Mr. Stillman each qualify as “independent” in accordance with the applicable regulations adopted by the SEC and American Stock Exchange.
Our board of directors has also established a compensation committee. The principal functions of the compensation committee are to: make recommendations regarding compensation of the Company’s officers. (i) provide oversight and guidance for compensation and benefit programs for all employees of the Company; (ii) review and recommend compensation plans, policies, benefit programs and incentive plans to the full board of directors; (iii) approve individual executive officers’ compensation; (iv) prepare the report on executive compensation required to be included in our annual proxy statement. Our compensation committee is comprised of three directors consisting of Troy Nilson, Valery Tolkachev and Stephen Smoot. Our board of directors has also determined that Mr. Tolkachev qualifies as “independent” in accordance with the applicable regulations adopted by the SEC and the American Stock Exchange. Compensation for all other officers is also recommended to the board for determination, by the compensation committee.
56
While we have adopted a corporate governance and nominating committee charter, we currently do not have a standing nominating committee. Instead, our independent directors fulfill the role of a nominating committee. In general, when the board determines that expansion of the board or replacement of a director is necessary or appropriate, the independent directors will review, through candidate interviews with members of the other members of the board and management, consult with the candidate’s associates and through other means determine a candidate’s honesty, integrity, reputation in and commitment to the community, judgment, personality and thinking style, residence, willingness to devote the necessary time, potential conflicts of interest, independence, understanding of financial statements and issues, and the willingness and ability to engage in meaningful and constructive discussion regarding Company issues. The independent directors review any special expertise, for example, that qualifies a person as an audit committee financial expert, membership or influence in a particular geographic or business target market, or other relevant business experience. To date we have not paid any fee to any third party to identify or evaluate, or to assist it in identifying or evaluating, potential director candidates.
The independent directors will consider director candidates nominated by shareholders during such times as the Company is actively considering obtaining new directors. Candidates recommended by shareholders will be evaluated based on the same criteria described above. Shareholders desiring to suggest a candidate for consideration should send a letter to the Company’s Secretary and include: (a) a statement that the writer is a shareholder (providing evidence if the person’s shares are held in street name) and is proposing a candidate for consideration; (b) the name and contact information for the candidate; (c) a statement of the candidate’s business and educational experience; (d) information regarding the candidate’s qualifications to be director, including but not limited to an evaluation of the factors discussed above which the board would consider in evaluating a candidate; (e) information regarding any relationship or understanding between the proposing shareholder and the candidate; (f) information regarding potential conflicts of interest; and (g) a statement that the candidate is willing to be considered and willing to serve as director if nominated and elected. Because of the small size of the Company and the limited need to seek additional directors, there is no assurance that all shareholder proposed candidates will be fully considered, that all candidates will be considered equally, or that the proponent of any candidate or the proposed candidate will be contacted by the Company or the board, and no undertaking to do so is implied by the willingness to consider candidates proposed by shareholders.
Our board may establish other committees from time to time to facilitate our management.
Compliance with Section 16(a) of the Exchange Act
Based solely on a review of Forms 3, 4 and 5 and amendments thereto furnished to us during its most recent fiscal year, it appears that Askar Tashtitov and Len Stillman inadvertently failed to timely file Form 3s at the time they respectively became an executive officer and a director of the Company. Sanat Kasymov inadvertently failed to timely file Form 4s in June 2006 when he received a restricted stock grant and in February 2007 when part of a previously granted restricted stock grant vested. Askar Tashtitov inadvertently failed to timely file Form 4s in June 2006 when he received a restricted stock grant and in December 2006 when part of a previously granted restricted stock grant vested. These delinquencies are being resolved by the filing of Form 5s by Mr. Kasymov and Mr. Tashtitov simultaneously with the filing of this annual report. Gamal Kulumbetov inadvertently failed to timely file a Form 4 in June 2006 when he received a restricted stock grant. We anticipate this will be remedied by the filing of a Form 5 in the near future.
57
Code of Ethics
We have adopted a Code of Ethics that applies to our principal executive, financial and accounting officers and persons performing similar duties. The Code is designed to deter wrong-doing and promote honest and ethical behavior, full, fair, timely, accurate and understandable disclosure and compliance with applicable governmental laws, rules and regulations. It is also designed to encourage prompt internal reporting of violations of the Code to an appropriate person and provides for accountability for adherence to the Code. A copy of our Code of Ethics has been posted on our website and may be viewed at www.bmbmunai.com. A copy of the Code of Ethics will be provided to any person without charge upon written request to our Assistant Secretary at our U.S. offices, 324 South 400 West, Suite 250, Salt Lake City, Utah 84101.
Item 11. Executive Compensation
Compensation Discussion and Analysis
We have a compensation committee of three independent directors. That committee has been delegated authority from our board of directors and its activities are governed by a compensation committee charter. One of the roles of the compensation committee under its charter is to review and approve annually all compensation decisions relating to our executive officers. Our compensation committee utilizes external analyses and other benchmarking to inform its executive compensation decisions and processes.
Objectives and Philosophy of Our Executive Compensation Program
The primary objectives of our executive compensation program are to:
|
|
• |
|
attract, retain and motivate skilled and knowledgeable executive talent; |
|
|
• |
|
ensure that executive compensation is aligned with our corporate strategies and business objectives; |
|
|
• |
|
promote the achievement of key strategic and financial performance measures by linking short- and long-term cash and equity incentives to the achievement of measurable corporate and individual performance goals; and |
|
|
• |
|
align executives’ incentives with the creation of stockholder value. |
To achieve these objectives, our compensation committee evaluates our executive compensation program with the objective of setting compensation at levels the committee believes to be competitive with those of other companies in our industry. In addition, our executive compensation program ties a portion of each executive’s overall compensation to key strategic, financial and operational goals set by our board of directors, such as satisfying our annual minimum work program. We also provide a portion of our executive compensation in the form of equity awards that vest over time, which we believe will help to retain our executives and to align their interests with those of our stockholders by allowing the executives to participate in our longer term success as reflected in asset growth and stock price appreciation.
Components of our Executive Compensation Program
At this time, the primary elements of our executive compensation program are:
58
|
|
• |
|
base salaries; |
|
|
• |
|
cash bonuses; |
|
|
• |
|
equity incentive awards; and |
|
|
• |
|
benefits and other compensation. |
We do not have any formal or informal policy or target for allocating compensation between long-term and short-term compensation, between cash and non-cash compensation or among the different forms of non-cash compensation. Instead, we have determined subjectively on a case-by-case basis the appropriate level and mix of the various compensation components.
Base salaries
Base salaries are used to recognize the experience, skills, knowledge and responsibilities required of all our employees, including our executives. Base salaries for our executives typically have been set in our offer letter to the executive at the outset of employment. In April 2007 we entered into employment agreements with our executive officers and certain of our non-executive level officers. Under the terms of these employment agreements, consistent with our executive compensation program objectives, base salaries for our executives, together with other components of compensation, may be evaluated by our compensation committee for adjustment based on an assessment of an executive’s performance and compensation trends in our industry.
Cash bonuses
We have not relied on cash bonuses in recent years as a form of executive compensation. We last awarded cash bonuses to executive officers in fiscal 2004. While he have not awarded cash bonuses recently, and we have no current commitment to award cash bonuses during fiscal 2008, our compensation committee has the discretion to award cash bonuses based on our financial performance and individual objectives. The corporate financial performance measures, which have typically been developed by our board of directors, are given the greatest weight in this bonus analysis.
Equity incentive awards
Our equity award program is the primary vehicle for offering long-term incentives to our executives. Our equity awards to executives have typically been made in the form of restricted stock grants and stock options. Although we do not have any equity ownership guidelines for our executives, we believe that equity grants provide our executives with a direct link to our long-term performance, create an ownership culture and align the interests of our executives and our stockholders. In addition, the vesting feature of our equity grants should further our objective of executive retention because this feature provides an incentive to our executives to remain in our employ during the vesting period.
In determining the size of equity grants to our executives, our compensation committee and board of directors have considered comparative share ownership of executives in our compensation peer group, our company-level performance, the applicable executive’s performance, the amount of equity previously awarded to the executive, the vesting of such awards and the recommendations of management.
59
Grants of equity awards, including those to executives, are all approved by our compensation committee and the board of directors and generally are granted based on the fair market value of our common stock. In the past, vesting of equity awards has varied from immediate vesting to vesting of periods ranging from three to five years depending on the purpose of the award. When we made equity awards that vested immediately, they were typically in recognition of services already rendered or goals already accomplished. During fiscal 2007, the compensation committee moved to tie the vesting of equity awards to the realization of certain company goals, such as reaching certain levels of stable production or reaching commercial production stage.
Typically in the fourth quarter of each year, at the discretion of our compensation committee and consistent with our executive compensation program objectives, our compensation committee and our board of directors approves new equity awards to reestablish or bolster incentives to retain employees, including executives. In determining the equity awards for each of the executives set forth on the table Grants of Plan-Based Awards in 2007 below, our board of directors took into account company-level performance, the applicable executive’s performance and informal benchmarking by executive position against companies in our industry and related industries.
We do not have a program, plan or practice of selecting grant dates for equity compensation to our executive officers in coordination with the release of material non-public information. Equity award grants are made from time to time in the discretion of our compensation committee consistent with our executive compensation program objectives.
Benefits and other compensation.
Under the terms of their employment contracts, our named executive officers are permitted to participate in such pension, profit sharing, bonus, life insurance, hospitalization, major medical and other employee benefits plans as may be in effect with the Company from time to time to the extent the executive is eligible under the terms of those plans.
Under the employment agreements with our named executive officer, we agree to pay all taxes and dues under applicable laws of Kazakhstan for our named executive officers including income and social taxes and government pension fund payments.
|
|
Social tax |
We make payments of mandatory social tax in the amount from 10% to 13% of employee wages. These costs are recorded in the period when they are incurred and presented as salary related tax expense in the income statement.
Pension fund payment
In accordance with the legislative requirements of the Republic of Kazakhstan during 2006 we were required to pay into an employee pension fund an amount equivalent to 10% of each employee’s monthly wages, (but not more than $600). Pension fund payments are withheld from employees’ salaries and included with other salary costs in the income statement. We do not have any other liabilities related to any supplementary pensions, post retirement health care, insurance benefits or retirement indemnities.
60
Summary Compensation Table for Fiscal Year 2007
The table below summarized 2007 compensation paid to or earned by our Chief Executive Officer, our Chief Financial Officer and our other most highly compensated executive officers, who we refer to collectively as our “named executive officers.”
|
Name and Principal Position |
Year |
Salary ($) |
Stock Awards (1) ($) |
Option Awards(2) ($) |
All Other Compensation(3) ($) |
Total ($) |
|
|
|
|
|
|
|
|
|
Boris Cherdabayev |
2007 |
284,960 |
560,000 |
409,010 |
109,433 |
1,363,403 |
|
CEO |
|
|
|
|
|
|
|
|
|
|
|
|
|
|
|
Sanat Kasymov |
2007 |
118,560 |
327,500 |
-0- |
48,256 |
494,316 |
|
CFO |
|
|
|
|
|
|
|
|
|
|
|
|
|
|
|
Gamal Kulumbetov |
2007 |
72,500 |
280,000 |
-0- |
32,969 |
385,469 |
|
COO |
|
|
|
|
|
|
|
|
|
|
|
|
|
|
|
Askar Tashtitov |
2007 |
77,099 |
327,500 |
-0- |
33,244 |
437,843 |
|
President |
|
|
|
|
|
|
|
|
(1) |
Represents the dollar amount recognized for financial statement reporting purposes during the year ended March 31, 2007 in accordance with FAS 123(R) with respect to restricted stock grants awarded on June 20, 2006. The restricted stock grants were valued at $7.00 per share, which represented the closing market price for our common stock on the date of grant. All shares vested upon grant. Mr. Cherdabayev was granted 80,000 shares, Mr. Kasymov, Mr. Kulumbetov and Mr. Tashtitov were each granted 40,000 shares. Also 10,000 shares valued at $4.75 per share vested during current fiscal year for each Mr. Kasymov and Mr. Tashtitov. These shares were issued on June 18, 2005 and vest in three tranches at each employment anniversary for these officers. |
|
|
(2) |
Represents the dollar amount recognized for financial statement reporting purposes during the year ended March 31, 2007 in accordance with FAS 123(R) with respect to stock options awarded on June 20, 2006. The options are exercisable at a price of $7.00 per share, which was the closing price of our common stock on the OTCBB on June 20, 2006. The options will expire three years from the grant date. All of the options vested immediately upon grant. Mr. Cherdabayev was granted 150,000 options. |
|
|
(3) |
Represents the following amounts: Mr. Cherdabayev, pension fund payment $6,833, income tax expense $68,920, social tax expense $28,974, other compensation $4,706; Mr. Kasymov, pension fund payment $6,833, income tax expense $26,321, social tax expense $12,645, other compensation $2,457; Mr. Kulumbetov, pension fund payment $6,699, income tax expense $14,609, social tax expense $9,391, other compensation $2,270; Mr. Tashtitov, pension fund payment $6,685, income tax expense $15,077, social tax expense $9,221, other compensation $2,262. |
Employment Agreements
As discussed above, on April 6, 2007 we entered into employment agreements with our named executive officers.
The following table discloses the corporate office and annual salary set forth in the employment agreement of each officer. Each of these individuals was serving in such capacity prior to entering the employment agreements.
|
Name |
|
Corporate Office |
|
Annual Salary |
|
|
|
|
|
|
|
Boris Cherdabayev |
|
Chief Executive Officer |
|
$240,000(1) |
|
Sanat Kasymov |
|
Chief Financial Officer |
|
$120,000(1) |
|
Gamal Kulumbetov |
|
Chief Operating Officer |
|
$120,000(1) |
|
Askar Tashtitov |
|
President |
|
$120,000(1) |
(1) Annual salary is net of all taxes and dues required under applicable laws of the Republic of Kazakhstan, which shall be the responsibility of the Company.
61
Except for annual salary, and as otherwise specifically addressed herein, the terms and conditions of the employment agreement of each of the executive and non-executive level officers are the same in all material respects. A form of the Employment Agreement was filed as an exhibit to the Current Report on Form 8-K we filed on April 12, 2007.
The employment agreements provide for an initial term of one year with two consecutive one-year renewals unless terminated by either party prior to the beginning of the renewal term.
The employment agreements of all of the above listed individuals require these individuals to devote their entire business time, attention, skill and energy exclusively to our business.
As discussed above, the employment agreements provide for an annual salary. Under the agreements, salary is reviewable no less frequently than annually and may be adjusted up or down by the compensation committee in its sole discretion, but may not be adjusted below the initial annual salary amount listed in the agreement. The agreements provide that each of the officers is entitled to participate in such pension, profit sharing, bonus, life insurance, hospitalization, major medical and other employee benefit plans of the company that may be in effect from time to time, to the extent he is eligible under the terms of those plans. The agreements provide that each officer is eligible at the discretion of the compensation committee and the board of directors to receive performance bonuses. Each officer is entitled to 28 days vacation in accordance with the vacation policies of the company, as well as paid holidays and other paid leave set forth in the Company’s policies. There is no accrual of vacation days and holidays.
The agreements and, as detailed below, all obligations thereunder may be terminated upon the occurrence of the following events: i) death, ii) disability; iii) for cause immediately upon notice from the Company or at such time as indicated by the Company in said notice; iv) for good reason upon not les than 30 days notice from the officer to the Company; v) an extraordinary event, unless otherwise agreed in writing.
Under the agreements the officer may be deemed disabled if for physical or mental reasons he is unable to perform his duties for 120 consecutive days or 180 days during any 12 month period. Such disability will be determined by a jointly agreed upon medical doctor.
The agreements provide that any of the following will constitute “cause”: i) breach of the employment agreement; ii) failure to adhere to the written policies of the Company; iii) appropriation by the officer of a material business opportunity; iv) misappropriation of funds or property of the Company; v) conviction, indictment or the entering of a guilty plea or a plea of no contest to a felony.
“Good reason” under the agreement may mean any of the following: i) a material breach of the employment agreement; ii) assignment of the officer without his consent to a position of lesser status or degree of responsibility.; iii) relocation of the Company’s principal executive offices outside the Republic of Kazakhstan; iv) if the Company requires the officer to be based somewhere other than principal executive offices of the Company without the officer’s consent.
Under the employment agreements, “extraordinary event” is defined as any consolidation or merger of the Company or any of its subsidiaries with another person, or any acquisition of the Company or any of its subsidiaries by any person or group of persons, acting in concert, equal to thirty percent (30%) or more of the outstanding stock of the Company or any of its subsidiaries, or the sale of all or substantially all of the assets of the Company or any of its subsidiaries.
62
Upon termination of an employment agreement, the Company will make a termination payment to the officer in lieu of all other amounts and in settlement and complete release of all claims employee may have against the Company. In the event of termination for good reason by the officer, the Company will pay the officer the remainder of his salary for the calendar month in which the termination is effective and for six consecutive calendar months thereafter. The officer shall also be entitled to any portion of incentive compensation for the year, prorated to the date of termination. Notwithstanding the foregoing, if the officer obtains other employment prior to the end of the six-month period, salary payments by the Company after he begins employment with a new employer shall be reduced by the amount of the cash compensation received from the new employer. If the officer is terminated for cause, he will receive salary only through the date of termination and will not be entitled to any incentive compensation for the year in which his employment is terminated. If the termination is the result of a disability, the Company will pay salary for the rest of the month during which termination is effective and for the shorter of six consecutive months thereafter or until disability insurance benefits commence. If employment is terminated as a result of the death of the officer, his heirs shall be entitled to salary through the month in which his death occurs and to incentive compensation prorated through the month of his death. If the employment agreement is terminated as a result of an extraordinary event, the officer shall be entitled to severance pay as follows:
|
Completed Years of Employment |
|
|
Service with the Employer |
Severance Amount |
|
Less than one (1) year |
10% of Basic Compensation Salary |
|
At least one (1) year but less than two (2) years |
150% of Basic Compensation Salary |
|
More than two years |
299% of Basic Compensation Salary |
All benefits terminate on the date of termination. The officer shall be entitled to accrued benefits. In accordance with local Kazakh legislation, a Kazakhstan-based officer would also be entitled to compensation for unused vacation, holiday, sick leave or other leave.
Grants of Plan-Based Awards Table for Fiscal Year 2007
|
Name |
Grant date |
All Other Stock Awards: Number of Shares (#) |
All Other Option Awards: Number of Securities Underlying Options (#) |
Exercise or Base Price of Option Awards ($/Sh) |
Grant Date Fair Value of Stock and Option Awards |
|
|
|
|
|
|
|
|
Boris Cherdabayev |
June 20, 2006 |
80,000 |
150,000 |
7.00 |
969,010 (1) |
|
Sanat Kasymov |
June 20, 2006 |
50,000 |
-0- |
- |
327,500 (1) |
|
Gamal Kulumbetov |
June 20, 2006 |
40,000 |
-0- |
- |
280,000 (1) |
|
Askar Tashtitov |
June 20, 2006 |
50,000 |
-0- |
- |
327,500 (1) |
|
|
|
|
|
|
|
|
Boris Cherdabayev |
March 30, 2007 |
150,000 |
-0- |
- |
807,000 (2) |
|
Sanat Kasymov |
March 30, 2007 |
100,000 |
-0- |
- |
538,000 (2) |
|
Gamal Kulumbetov |
March 30, 2007 |
100,000 |
-0- |
- |
538,000 (2) |
|
Askar Tashtitov |
March 30, 2007 |
100,000 |
-0- |
- |
538,000 (2) |
|
|
|
|
|
|
|
63
(1) See discussion of assumptions made in valuing these awards in the notes to the company’s consolidated financial statements.
(2) See discussion of assumptions made in valuing these awards in the notes to the company’s consolidated financial statements. None of the grant date fair value of these stock awards was recorded for the financial reporting purposes as compensation expense in the year ended March 31, 2007 because the grants were outstanding for only one day during fiscal 2007.
Outstanding Equity Awards at Fiscal Year End Table for Fiscal Year End 2007
The following table sets forth information regarding the outstanding stock options held by our named executive officers as of March 31, 2007.
|
|
Option awards |
Stock awards |
|||
|
Name |
Number of Securities Underlying Unexercised Options (#) Exercisable |
Option Exercise Price |
Option Expiration Date |
Number of Shares or Units of Stock That Have Not Vested (#) |
Market Value of Shares or Units of Stock That Have Not Vested ($) |
|
|
|
|
|
|
|
|
Boris Cherdabayev |
410,256 (1) |
4.75 |
07/18/2010 |
150,000 (2) |
$ 807,000 |
|
Boris Cherdabayev |
150,000 (1) |
7.00 |
06/20/2009 |
- |
- |
|
Sanat Kasymov |
-0- |
-0- |
- |
100,000 (2) |
538,000 |
|
Sanat Kasymov |
-0- |
-0- |
- |
10,000 (3) |
47,500 |
|
Gamal Kulumbetov |
-0- |
-0- |
- |
100,000 (2) |
538,000 |
|
Askar Tashtitov |
-0- |
-0- |
- |
100,000 (2) |
538,000 |
|
Askar Tashtitov |
-0- |
-0- |
- |
10,000 (4) |
47,500 |
|
|
(1) |
Option awards vested at the date they were granted. |
|
|
(2) |
These stock grants will vest to the grantees at such time as either of the following events occurs (the “Vesting Events”): i) the Company enters commercial production and is granted a commercial production license from the Republic of Kazakhstan; or ii) the occurrence of an Extraordinary Event. An “Extraordinary Event” is defined in the restricted stock agreement as any consolidation or merger of the Company or any of its subsidiaries with another person, or any acquisition of the Company or any of its subsidiaries by any person or group of persons, acting in concert, equal to thirty percent (30%) or more of the outstanding stock of the Company or any of its subsidiaries, or the sale of all or substantially all of the assets of the Company or any of its subsidiaries. |
|
|
(3) |
These stock grants will vest on February 14, 2008. |
|
|
(4) |
These stock grants will vest on December 1, 2007. |
Option Exercises and Stock Vested for Fiscal Year 2007
The following table sets forth the number of shares acquired pursuant to the exercise of stock options by, and the number of restricted stock awards that vested for, our named executive officers during fiscal 2007 and the aggregate dollar amount realized by our named executive officers upon exercise of options.
|
|
Option awards |
Stock awards |
|||
|
Name |
|
Number
of |
Value |
Number
of Shares |
Value
Realized |
|
|
|
|
|
|
|
|
Boris Cherdabayev |
|
-0- |
-0- |
80,000 |
$ 560,000 |
|
Sanat Kasymov |
|
-0- |
-0- |
50,000 |
327,500 |
|
Gamal Kulumbetov |
|
-0- |
-0- |
40,000 |
280,000 |
|
Askar Tashtitov |
|
-0- |
-0- |
50,000 |
327,500 |
64
Compensation of Directors
We use a combination of cash and equity-based compensation to attract and retain candidates to serve on our board of directors. We do not compensate directors who are also our employees for their service on our board of directors. Therefore, Mr. Cherdabayev did not receive any compensation for his service on our board of directors.
Meeting Fees
Members of the board of directors who are not employees of the Company are paid a $25,000 stipend per year, plus $1,000 for each directors meeting attended in person, plus airfare and hotel expenses.
Equity Compensation
We do not currently have a fixed plan for the award of equity compensation to our non-employee directors. Equity compensation of non-employee directors, if any, is typically recommended by the compensation committee or management and is subject to approval of the full board of directors. All equity grants to directors are granted at a price equal to the fair market value of our common stock on the date of the grant. We anticipate that the vesting, exercise date and expiration date of future grants will vary.
Director Compensation Table
The following table sets forth a summary of the compensation we paid to our non-employee directors for services on our board during our 2007 fiscal year.
|
Name |
Fees Earned or Paid in Cash ($) |
Stock Awards ($) |
Option Awards ($) |
Non-Equity Incentive Plan Compensation ($) |
Nonqualified Deferred Compensation Earnings ($) |
All Other Compen-sation ($) |
Total ($) |
|
|
|
|
|
|
|
|
|
|
Troy Nilson |
25,000 |
70,000 |
-0- |
-0- |
-0- |
-0- |
$95,000 |
|
Stephen Smoot |
25,000 |
70,000 |
-0- |
-0- |
-0- |
1,000 |
96,000 |
|
Valery Tolkachev |
25,000 |
280,000 |
136,337 |
-0- |
-0- |
1,000 |
442,337 |
|
Leonard Stillman |
12,500 |
-0- |
-0- |
-0- |
-0- |
-0- |
12,500 |
Compensation Committee Interlocks and Insider Participation
Mr. Nilson, Mr. Smoot and Mr. Tolkachev have served on our compensation committee during the entire 2007 fiscal year. No member of our compensation committee during fiscal 2007 is or was formerly an officer or employee of the Company or any of its subsidiaries. No interlocking relationship exists between any member of our compensation committee and the compensation committee of any other company, nor has any such interlocking relationship existed in the past.
65
Compensation Committee Report
The compensation committee of the board of directors has reviewed and discussed the Compensation Discussion and Analysis required by Item 402(b) of Regulation S-K with management and, based on such review and discussions, the compensation committee recommended to the board of directors that the Compensation Discussion and Analysis be included in this Annual Report on Form 10-K.
|
|
|
COMPENSATION COMMITTEE OF THE BOARD OF DIRECTORS |
|
|
|
Troy Nilson, Chairman Stephen Smoot Valery Tolkachev |
|
Item 12. |
Security Ownership of Certain Beneficial Owners and Management |
The term “beneficial owner” refers to both the power of investment and the right to buy and sell our shares. It also refers to rights of ownership or the right to receive distributions from the Company and proceeds from the sale of Company shares. Since these rights may be held or shared by more than one person, each person who has a beneficial ownership interest in shares is deemed to be the beneficial owners of the same shares because there is shared power of investment or shared rights of ownership.
The following table sets forth as of June 7, 2007, the name and the number of shares of our common stock, par value of $0.001 per share, held of record or beneficially by each person who held of record, or was known by us to own beneficially, more than 5% of the 44,690,657 outstanding shares of our common stock, and the name and shareholdings of each director and of all executive officers and directors as a group.
|
Type of Security |
Name and Address |
Amount & Nature of Beneficial Ownership |
% of Class |
|
|
|
|
|
|
Common |
Bakhytbek Baiseitov |
4,267,177(1) |
10%(9) |
|
|
100 Shevchenko Street |
|
|
|
|
Almaty, Kazakhstan 480072 |
|
|
|
|
|
|
|
|
Common |
Boris Cherdabayev |
6,674,983(2) |
15%(9) |
|
|
202 Dostyk Ave, 4th Floor |
|
|
|
|
Almaty, Kazakhstan 050051 |
|
|
|
|
|
|
|
|
Common |
Sanat Kasymov |
170,000(3) |
* |
|
|
202 Dostyk Ave, 4th Floor |
|
|
|
|
Almaty, Kazakhstan 050051 |
|
|
|
|
|
|
|
|
Common |
Gamal Kulumbetov |
140,000(4) |
* |
|
|
202 Dostyk Ave, 4th Floor |
|
|
|
|
Almaty, Kazakhstan 050051 |
|
|
|
|
|
|
|
|
Common |
Troy Nilson |
10,000 |
* |
|
|
533 West 2600 South #250 |
|
|
|
|
Bountiful, Utah 84010 |
|
|
66
|
|
|
|
|
|
Common |
Stephen Smoot |
10,000 |
* |
|
|
875 Donner Way, Suite 705 |
|
|
|
|
Salt Lake City, Utah 84108 |
|
|
|
|
|
|
|
|
Common |
Leonard Stillman |
0 |
* |
|
|
5794 West Poll |
|
|
|
|
Mountain Green, Utah 84050 |
|
|
|
|
|
|
|
|
Common |
Askar Tashtitov |
170,000(5) |
* |
|
|
202 Dostyk Ave, 4th Floor |
|
|
|
|
Almaty, Kazakhstan 050051 |
|
|
|
|
|
|
|
|
Common |
Valery Tolkachev |
190,000(6) |
*(9) |
|
|
27/6 Pokrovka St., Building 6 |
|
|
|
|
Moscow, Russia 105062 |
|
|
|
|
|
|
|
|
Common |
Toleush Tolmakov |
2,900,365(7) |
6% |
|
|
Daulet village, oil storage depot |
|
|
|
|
Aktau, Kazakhstan 466200 |
|
|
|
|
|
|
|
|
Common |
Touradji Capital Management, LP |
2,266,365 |
5% |
|
|
101 Park Avenue, 47th Floor |
|
|
|
|
New York, New York 10178 |
|
|
|
|
|
|
|
|
Officers, Directors and Nominees |
7,364,983 |
16%(9) |
|
|
as a Group: (8 persons) |
|
|
|
* Less than 1%.
(1) Mr. Baiseitov holds 1,714,286 shares in his own name and 2,552,891 shares in the name of MB-Invest LLC, a Kazakhstan limited company, in which Mr. Baiseitov holds a 100% interest and therefore may be deemed to have voting and investment power over the shares held by MB-Invest LLC.
(2) The shares attributed to Mr. Cherdabayev include 2,552,126 shares held of record by Westfall Group Limited FBO Boris Cherdabayev, immediately exercisable options held by Mr. Cherdabayev to acquire 560,256 shares of our common stock and 3,562,601 shares held of record by Mr. Cherdabayev. The investment power and pecuniary interest in 150,000 of the shares held of record by Mr. Cherdabayev, have not yet vested to Mr. Cherdabayev and will not vest until the Company moves to commercial production or upon the occurrence of a vesting event, as discussed in Item 5 above. Mr. Cherdabayev does, however, currently hold the voting rights over these shares.
(3) The shares attributable to Mr. Kasymov include 100,000 shares over which he currently holds voting rights, but the investment power and pecuniary interest in these shares have not yet vested to Mr. Kasymov and will not vest until the Company moves to commercial production or upon the occurrence of a vesting event, as discussed in Item 5 above. The shares attributable to Mr. Kasymov also includes 10,000 shares that will not vest to Mr. Kasymov until February 14, 2008. Until such time as these shares vest, Mr. Kasymov does not have voting or investment control over the shares, nor does he have a pecuniary interest in the shares.
(4) The shares attributable to Mr. Kulumbetov include 100,000 shares over which he currently holds voting rights, but the investment power and pecuniary interest in these shares have not yet vested to Mr. Kulumbetov and will not vest until the Company moves to commercial production or upon the occurrence of a vesting event, as discussed in Item 5 above.
(5) The shares attributable to Mr. Tashtitov include 100,000 shares over which he currently holds voting rights, but the investment power and pecuniary interest in these shares have not yet vested to Mr. Tashtitov and will not vest until the Company moves to commercial production or upon the occurrence of a vesting event, as discussed in Item 5 above. The shares attributable to Mr. Tashtitov also includes 10,000 shares that will not vest to Mr. Tashtitov until December 1, 2007. Until such time as these shares vest, Mr. Tashtitov does not have voting or investment control over the shares, nor does he have a pecuniary interest in the shares.
(6) The shares attributed to Mr. Tolkachev include 71,579 shares of common stock held of record by Mr. Tolkachev and immediately exercisable options to acquire 118,421 shares of our common stock.
(7) The shares attributable to Mr. Tolmakov include 100,000 shares over which he currently holds voting rights, but the investment power and pecuniary interest in these shares have not yet vested to Mr. Tolmakov and will not vest until the Company moves to commercial production or upon the occurrence of a vesting event, as discussed in Item 5 above.
(8)Mr. Paul Touradji is the General Partner of Touradji Capital Management.
(9) The percentages reflect the increase in the number of common shares that would be issued in connection with the exercise of outstanding options.
67
Messers. Cherdabayev, Kasymov, Kulumbetov and Tashtitov are officers of the Company. Mr. Tolmakov is an officer of the Company’s wholly-owned subsidiary, Emir Oil, LLP. Messers. Cherdabayev, Nilson, Smoot, Stillman and Tolkachev are directors of the Company.
Item 13. Certain Relationships and Related Transactions and Director Independence
During 2007, 2006 and 2005 we have leased land, oil storage facilities and office and warehouse space in Aktau, Kazakhstan from Term Oil LLC. Last year we negotiated a five-year extension of this lease. The basic terms of the new lease are unchanged, including the initial monthly rental payment, which did not increase. We expect to continue to lease these facilities for the full term of our agreement with Term Oil LLC, which now expires on December 31, 2009. During the fiscal years ended March 31, 2007, 2006 and 2005 we paid Term Oil $203,686, $276,055 and $218,428, respectively for the use of these facilities. Toleush Tolmakov, a BMB shareholder and director of Emir Oil is the owner of Term Oil.
In accordance with the written policy adopted by our board of directors and the AMEX listing standards, our audit committee is charged with monitoring and reviewing issues involving potential conflicts of interests and reviewing and approving all related party transactions. In general, for purposes of the Company’s written policy, a related party transaction is a transaction, or a material amendment to any such transaction, involving a related party and the Company involving $120,000 or more. Our policy required the audit committee to review and approve related party transactions. In reviewing and approving any related party transaction or material amendment to any such transaction, the audit committee must satisfy itself that it has been fully informed as to the related party’s relationship to the Company and interest in the transaction and as to the material facts of the transaction, and must determine that the related party transaction is fair to the Company.
Director Independence
The board of directors has determined that, with the exception of Boris Cherdabayev the Chairman of our board of directors and our Chief Executive Officer, all of the members of our board are “independent directors” as that term is defined in the listing standards of the American Stock Exchange. Such independence definition includes a series of objective tests, including that the director is not an employee of the company and has not engaged in various types of business dealings with the company. In addition, as further required by the American Stock Exchange listing standards, the board of directors has made a subjective determination as to each independent director that no relationships exist which, in the opinion of the board of directors, would interfere with the exercise of independent judgment in carrying out the responsibilities of a director.
Item 14. Principal Accounting Fees and Services
On February 21, 2007, the audit committee of the board of directors of BMB Munai, Inc. (the “Company”) terminated the engagement of BDO Kazakhstanaudit, who had served as the Company’s independent registered public accounting firm since February 2004. On February 21, 2007, the Company engaged Hansen, Barnett & Maxwell, Certified Public Accountants to serve as the Company’s independent registered public accounting firm.
Principal accounting fees for professional services rendered for us by Hansen, Barnett & Maxwell P.C. and BDO Kazakhstanaudit for the years ended March 31, 2007 and 2006 were:
68
|
|
|
Fiscal 2007 |
|
Fiscal 2006 |
|
|
|
|
|
|
|
Audit |
|
$226,465 |
|
$168,645 |
|
Audit related |
|
- |
|
- |
|
Tax |
|
2,508 |
|
- |
|
All other |
|
- |
|
- |
|
Total |
|
$228,973 |
|
$168,645 |
Audit Fees. Audit fees were for professional services rendered in connection with the audit of the financial statement included in our annual report on Form 10-K and review of the financial statements included in our quarterly reports of Form 10-Q. or for services normally provided by our independent registered public accounting firm in connection with statutory and regulatory filings or engagements and fees for Sarbanes-Oxley 404 audit work.
Tax Fees. Hansen Barnett & Maxwell billed us an aggregate of $2,508 for professional services rendered for tax compliance, tax advice and tax planning within the United States for the fiscal year ended March 31, 2007.
Audit Committee Pre-Approval Policies and Procedures. The Audit Committee had not, as of the time of filing this Annual Report on Form 10-K with the Securities and Exchange Commission, adopted policies and procedures for pre-approving audit or permissible non-audit services performed by our independent auditors. Instead, the Audit Committee as a whole has pre-approved all such services. In the future, our Audit Committee may approve the services of our independent auditors pursuant to pre-approval policies and procedures adopted by the Audit Committee, provided the policies and procedures are detailed as to the particular service, the Audit Committee is informed of each service, and such policies and procedures do not include delegation of the Audit Committee’s responsibilities to our management.
The Audit Committee has determined that the provision of services by Hansen, Barnett & Maxwell described above are compatible with maintaining Hansen, Barnett & Maxwell’s independence at our independent registered public accounting firm.
Item 15. Exhibits, Financial Statement Schedules
|
|
The following exhibits are included as part of this report: |
|
|
Exhibit 21.1 |
Subsidiaries |
|
|
Exhibit 23.1 |
Consent of Chapman Petroleum Engineering Ltd. |
|
|
Independent Petroleum Engineers |
|
|
Exhibit 23.2 |
Consent of Hansen, Barnett & Maxwell, P.C. |
|
|
Independent Registered Public Accounting Firm |
|
|
Exhibit 23.3 |
Consent of BDO Kazakhstanaudit, LLP |
|
|
Independent Registered Public Accounting Firm |
|
|
Exhibit 31.1 |
Certification of Principal Executive Officer Pursuant to |
|
|
Section 302 of the Sarbanes-Oxley Act of 2002 |
|
|
Exhibit 31.2 |
Certification of Principal Financial Officer Pursuant |
|
|
to Section 302 of the Sarbanes-Oxley Act of 2002 |
|
|
Exhibit 32.1 |
Certification of Principal Executive Officer Pursuant to Section |
906 of the Sarbanes-Oxley Act of 2002
|
|
Exhibit 32.2 |
Certification of Principal Financial Officer Pursuant to Section 906 |
of the Sarbanes-Oxley Act of 2002
69
|
|
SIGNATURES |
In accordance with Section 12 of the Securities Exchange Act of 1934, the registrant caused this report to be signed on its behalf, thereunto duly authorized.
BMB MUNAI, INC.
|
Date: January 4, 2008 |
/s/ Gamal Kulumbetov |
Gamal Kulumbetov
Chief Executive Officer
70
CONSOLIDATED FINANCIAL STATEMENTS
FOR THE YEARS ENDED MARCH 31, 2007, 2006 AND 2005
Table of contents
|
|
Page |
|
|
|
|
Report of Independent Registered Public Accounting Firm – Hansen, Barnett & Maxwell P.C. |
F-1 |
|
|
|
|
Report of Independent Registered Public Accounting Firm – BDO Kazakhstanaudit |
F-2 |
|
|
|
|
Consolidated Balance Sheets as of March 31, 2007 and 2006 |
F-3 |
|
|
|
|
Consolidated Statements of Operations for the years ended March 31, 2007, 2006 and 2005 |
F-4 |
|
|
|
|
Consolidated Statements of Shareholders’ Equity for the years ended March 31, 2007, 2006 and 2005 |
F-5 |
|
|
|
|
Consolidated Statements of Cash Flows for the years ended March 31, 2007, 2006 and 2005 |
F-6 |
|
|
|
|
Notes to the Consolidated Financial Statements |
F-8 |
|
|
|
|
Supplementary Financial Information on Oil and Natural Gas Exploration, Development, and Production Activities (unaudited) |
F-32 |
|
|
|
|
|
|
|
|
HANSEN, BARNETT & MAXWELL, P.C. |
|
|
Registered with the Public Company |
|
|
Accounting Oversight Board |
|
|
|

|
|
A Professional Corporation |
|
|
CERTIFIED PUBLIC ACCOUNTANTS |
|
|
AND |
|
|
BUSINESS CONSULTANTS |
|
|
5 Triad Center, Suite 750 |
|
|
Salt Lake City, UT 84180-1128 |
|
|
Phone: (801) 532-2200 |
|
|
Fax: (801) 532-7944 |
|
|
www.hbmcpas.com |
REPORT OF INDEPENDENT REGISTERED PUBLIC ACCOUNTING FIRM
To the Board of Directors and Stockholders
BMB Munai, Inc.
We have audited the accompanying consolidated balance sheet of BMB Munai, Inc. and subsidiary as of March 31, 2007, and the related consolidated statements of operations, shareholders’ equity, and cash flows for the year then ended. These financial statements are the responsibility of the Company’s management. Our responsibility is to express an opinion on these financial statements based on our audit.
We conducted our audit in accordance with the standards of the Public Company Accounting Oversight Board (United States). Those standards require that we plan and perform the audit to obtain reasonable assurance about whether the financial statements are free of material misstatement. An audit includes examining, on a test basis, evidence supporting the amounts and disclosures in the financial statements, assessing the accounting principles used and significant estimates made by management, as well as evaluating the overall financial statement presentation. We believe our audit provides a reasonable basis for our opinion.
In our opinion, the financial statements referred to above present fairly, in all material respects, the consolidated financial position of BMB Munai, Inc. and subsidiary as of March 31, 2007, and the consolidated results of their operations and their cash flows for the period ended March 31, 2007 in conformity with accounting principles generally accepted in the United States of America.
As discussed in Note 1 to the consolidated financial statements, the Company adopted Statement of Financial Accounting Standards No. 123R, Share-Based Payment, effective April 1, 2006.
We also have audited, in accordance with the standards of the Public Company Accounting Oversight Board (United States), the effectiveness of BMB Munai, Inc.’s internal control over financial reporting as of March 31, 2007, based on criteria established in Internal Control-Integrated Framework issued by the Committee of Sponsoring Organizations of the Treadway Commission and our report dated June 13, 2007 expressed an unqualified opinion thereon.
HANSEN, BARNETT & MAXWELL, P.C.
Salt Lake City, Utah
June 13, 2007
F-1
Report of Independent Registered Public Accounting Firm
The Board of Directors
BMB Munai, Inc.
We have audited the accompanying consolidated balance sheets of BMB Munai, Inc. as of March 31, 2006 and March 31, 2005, and the related consolidated statements of loss, shareholders’ equity, and cash flows for the years ended March 31, 2006 and March 31, 2005. These financial statements are the responsibility of the Company’s management. Our responsibility is to express an opinion on these financial statements based on our audits.
We conducted our audits in accordance with the Standards of the Public Company Accounting Oversight Board (United States). Those standards require that we plan and perform the audit to obtain reasonable assurance about whether the financial statements are free of material misstatements. The Company is not required to have, nor were we engaged to perform, an audit of its internal control over financial reporting. Our audits included consideration of internal control over financial reporting as a basis for designing audit procedures that are appropriate in the circumstances, but not for purposes of expressing an opinion on the effectiveness of the Company’s internal control over financial reporting. Accordingly, we express no such opinion. An audit also includes examining, on a test basis, evidence supporting the amounts and disclosures in the financial statements, assessing the accounting principles used and significant estimates made by management, as well as evaluating the overall financial statement presentation. We believe that our audits provide a reasonable basis for our opinion.
In our opinion, the financial statements referred to above present fairly, in all material respects, the consolidated financial position of BMB Munai, Inc. at March 31, 2006 and at March 31, 2005 and the consolidated results of its operations and its cash flow for the years ended March 31, 2006 and March 31, 2005 in conformity with accounting principles generally accepted in the United States of America.
/s/ BDO Kazakhstanaudit, LLP
June 26, 2006
Almaty, Kazakhstan
F-2
BMB MUNAI, INC.
CONSOLIDATED BALANCE SHEETS
|
|
Notes |
|
March 31, 2007 |
|
March 31, 2006 |
|
|
|
|
|
|
|
|
ASSETS
|
|
|
|
|
|
|
CURRENT ASSETS |
|
|
|
|
|
|
Cash and cash equivalents |
3 |
$ 12,172,940 |
|
$ 51,141,732 |
|
|
Trade accounts receivable |
|
3,994,662 |
|
1,675,202 |
|
|
Inventories |
4 |
10,334,696 |
|
3,239,947 |
|
|
Prepayments for materials |
|
1,409,213 |
|
712,526 |
|
|
Prepaid expenses and other assets, net |
5 |
2,060,024 |
|
566,920 |
|
|
Total current assets |
|
29,971,535 |
|
57,336,327 |
|
|
|
|
|
|
|
|
|
LONG TERM ASSETS |
|
|
|
|
|
|
Oil and gas properties, full cost method, net |
6 |
104,187,568 |
|
66,683,297 |
|
|
Other fixed assets, net |
7 |
1,519,123 |
|
1,070,607 |
|
|
Construction in progress |
8 |
4,463,063 |
|
- |
|
|
Long term VAT recoverable |
9 |
4,351,059 |
|
1,335,971 |
|
|
Restricted cash |
10 |
303,697 |
|
156,454 |
|
|
Total long term assets |
|
114,824,510 |
|
69,246,329 |
|
|
|
|
|
|
|
|
|
TOTAL ASSETS |
|
$ 144,796,045 |
|
$ 126,582,656 |
|
|
|
|
|
|
|
|
|
LIABILITIES AND SHAREHOLDERS’ EQUITY |
|
|
|
|
|
|
|
|
|
|
|
|
|
CURRENT LIABILITIES |
|
|
|
|
|
|
Accounts payable |
|
$ 8,542,052 |
|
$ 3,629,338 |
|
|
Due to reservoir consultants |
|
- |
|
500,000 |
|
|
Taxes payable |
|
324,053 |
|
145,406 |
|
|
Accrued liabilities and other payables |
|
254,194 |
|
349,231 |
|
|
Total current liabilities |
|
9,120,299 |
|
4,623,975 |
|
|
|
|
|
|
|
|
|
LONG TERM LIABILITIES |
|
|
|
|
|
|
Liquidation fund |
11 |
2,165,829 |
|
924,592 |
|
|
Deferred taxes |
12 |
7,948,297 |
|
6,405,285 |
|
|
Total long term liabilities |
|
10,114,126 |
|
7,329,877 |
|
|
|
|
|
|
|
|
|
COMMITMENTS AND CONTINGENCIES |
17 |
- |
|
- |
|
|
|
|
|
|
|
|
|
SHAREHOLDERS’ EQUITY |
|
|
|
|
|
|
Preferred stock - $0.001 par value; 20,000,000 shares authorized; no shares issued or outstanding |
13 |
- |
|
- |
|
|
Common stock - $0.001 par value; 500,000,000 and 100,000,000 shares authorized, respectively; 44,690,657 and 42,223,685 shares outstanding, respectively |
13 |
44,691 |
|
42,224 |
|
|
Additional paid in capital |
13 |
133,721,865 |
|
123,831,007 |
|
|
Accumulated deficit |
|
(8,204,936) |
|
(9,244,427) |
|
|
Total shareholders’ equity |
|
125,561,620 |
|
114,628,804 |
|
|
|
|
|
|
|
|
|
TOTAL LIABILITIES AND SHAREHOLDERS’ EQUITY |
|
$ 144,796,045 |
|
$ 126,582,656 |
|
See notes to the consolidated financial statements.
F-3
BMB MUNAI, INC.
CONSOLIDATED STATEMENTS OF OPERATIONS
|
|
Notes |
Year ended March 31, 2007 |
|
Year ended March 31, 2006 |
|
Year ended March 31, 2005 |
|
|
|
|
|
|
|
|
|
|
|
|
|
|
|
|
|
|
|
|
REVENUES |
14 |
$ 15,785,784 |
|
$ 5,956,731 |
|
$ 973,646 |
|
|
|
|
|
|
|
|
|
|
|
COSTS AND OPERATING EXPENSES |
|
|
|
|
|
|
|
|
Oil and gas operating |
|
2,272,251 |
|
875,319 |
|
406,361 |
|
|
General and administrative |
|
10,757,727 |
|
9,724,597 |
|
4,060,962 |
|
|
Depletion |
|
2,006,834 |
|
1,167,235 |
|
229,406 |
|
|
Amortization and depreciation |
|
170,610 |
|
133,148 |
|
66,451 |
|
|
Accretion expense |
|
173,519 |
|
5,602 |
|
- |
|
|
Total costs and operating expenses |
|
15,380,941 |
|
11,905,901 |
|
4,763,180 |
|
|
|
|
|
|
|
|
|
|
|
INCOME/(LOSS) FROM OPERATIONS |
|
404,843 |
|
(5,949,170) |
|
(3,789,534) |
|
|
|
|
|
|
|
|
|
|
|
OTHER INCOME (EXPENSE) |
|
|
|
|
|
|
|
|
Realized gain on marketable securities |
|
- |
|
236,878 |
|
185,067 |
|
|
Unrealized loss on marketable securities |
|
- |
|
- |
|
(252,767) |
|
|
Interest income, net |
|
1,490,381 |
|
434,659 |
|
17,799 |
|
|
Other (expense)/income, net |
|
(115,611) |
|
(18,110) |
|
53,945 |
|
|
Total other income |
|
1,487,928 |
|
639,880 |
|
503,565 |
|
|
|
|
|
|
|
|
|
|
|
INCOME/(LOSS) BEFORE INCOME TAXES |
|
1,892,771 |
|
(5,309,290) |
|
(3,285,969) |
|
|
|
|
|
|
|
|
|
|
|
INCOME TAX EXPENSE |
12 |
(853,280) |
|
(35,043) |
|
(343) |
|
|
|
|
|
|
|
|
|
|
|
NET INCOME/(LOSS) |
|
$ 1,039,491 |
|
$ (5,344,333) |
|
$ (3,286,312) |
|
|
|
|
|
|
|
|
|
|
|
BASIC NET INCOME / (LOSS) PER COMMON SHARE |
15 |
$ 0.02 |
|
$ (0.15) |
|
$ (0.12) |
|
|
–DILUTED NET INCOME / (LOSS) PER COMMON SHARE |
15 |
$ 0.02 |
|
$ (0.15) |
|
$ (0.12) |
|
|
|
|
|
|
|
|
|
|
See notes to the consolidated financial statements.
F-4
BMB MUNAI, INC
CONSOLIDATED STATEMENTS OF SHAREHOLDERS’ EQUITY
|
|
|
Common stock |
|
Additional paid-in |
|
Accumulated |
|
|
||||
|
|
Notes |
|
Shares |
|
Amount |
|
capital |
|
deficit |
|
Total |
|
|
|
|
|
|
|
|
|
|
|
|
|
||
|
At March 31, 2004 |
|
20,429,421 |
|
20,429 |
|
12,115,445 |
|
(613,782) |
|
11,522,092 |
||
|
|
|
|
|
|
|
|
|
|
|
|
||
|
Common stock issued in |
13 |
3,500,000 |
|
3,500 |
|
19,071,500 |
|
- |
|
19,075,000 |
||
|
Common stock issued in |
13 |
6,584,340 |
|
6,585 |
|
27,273,575 |
|
- |
|
27,280,160 |
||
|
Common stock issued for |
13 |
1,101,000 |
|
1,101 |
|
5,503,899 |
|
- |
|
5,505,000 |
||
|
Subscription receivable |
13 |
(1,101,000) |
|
(1,101) |
|
(5,503,899) |
|
- |
|
(5,505,000) |
||
|
Net loss for the year |
|
- |
|
- |
|
- |
|
(3,286,312) |
|
(3,286,312) |
||
|
|
|
|
|
|
|
|
|
|
|
|
||
|
At March 31, 2005 |
|
30,513,761 |
|
$ 30,514 |
|
$ 58,460,520 |
|
$ (3,900,094) |
|
$ 54,590,940 |
||
|
|
|
|
|
|
|
|
|
|
|
|
||
|
Common stock issued in |
13 |
10,267,667 |
|
10,268 |
|
57,400,624 |
|
- |
|
57,410,892 |
||
|
Options and warrants exercised |
13 |
902,514 |
|
902 |
|
2,996,767 |
|
- |
|
2,997,669 |
||
|
Stock grants and stock options issued |
13 |
539,743 |
|
540 |
|
4,973,096 |
|
- |
|
4,973,636 |
||
|
Net loss for the year |
|
- |
|
- |
|
- |
|
(5,344,333) |
|
(5,344,333) |
||
|
|
|
|
|
|
|
|
|
|
|
|
||
|
At March 31, 2006 |
|
42,223,685 |
|
$ 42,224 |
|
$ 123,831,007 |
|
$ (9,244,427) |
|
$ 114,628,804 |
||
|
|
|
|
|
|
|
|
|
|
|
|
||
|
Stock grants and stock options issued |
13 |
1,495,000 |
|
1,495 |
|
4,133,328 |
|
- |
|
4,134,823 |
||
|
Options and warrants exercised |
13 |
971,972 |
|
972 |
|
5,757,530 |
|
- |
|
5,758,502 |
||
|
Net income for the year |
|
- |
|
- |
|
- |
|
1,039,491 |
|
1,039,491 |
||
|
|
|
|
|
|
|
|
|
|
|
|
||
|
At March 31, 2007 |
|
44,690,657 |
|
$ 44,691 |
|
$ 133,721,865 |
|
$ (8,204,936) |
|
$ 125,561,620 |
||
See notes to the consolidated financial statements.
F-5
BMB MUNAI, INC.
CONSOLIDATED STATEMENTS OF CASH FLOWS
|
|
Notes |
Year ended March 31, 2007 |
|
Year ended March 31, 2006 |
|
Year ended March 31, 2005 |
|
CASH FLOWS FROM OPERATING ACTIVITIES: |
|
|
|
|
|
|
|
Net income / (loss) |
|
$ 1,039,491 |
|
$ (5,344,333) |
|
$ (3,286,312) |
|
Adjustments to reconcile net loss to net cash
provided |
|
|
|
|
|
|
|
Depletion |
6 |
2,006,834 |
|
1,167,235 |
|
229,406 |
|
Depreciation and amortization |
7 |
170,610 |
|
133,148 |
|
66,451 |
|
Accretion expenses |
11 |
173,519 |
|
5,602 |
|
- |
|
Stock based compensation expense |
13 |
3,679,823 |
|
4,800,954 |
|
- |
|
Stock issued for services |
13 |
455,000 |
|
172,682 |
|
- |
|
Provision expense for uncollectible advances and prepayments |
|
- |
|
66,401 |
|
129,051 |
|
Minority interest in operations of subsidiary |
|
- |
|
- |
|
(82,134) |
|
Gain on disposal of fixed assets |
|
(8,735) |
|
- |
|
- |
|
Income taxes |
12 |
853,280 |
|
35,043 |
|
343 |
|
Unrealized loss on marketable securities |
|
- |
|
- |
|
252,767 |
|
Changes in operating assets and liabilities |
|
|
|
|
|
|
|
Decrease in marketable securities |
|
- |
|
788,921 |
|
1,837,448 |
|
Increase in trade accounts receivable |
|
(2,319,460) |
|
(1,542,802) |
|
(132,400) |
|
Increase in inventories |
|
(7,094,749) |
|
(12,536) |
|
(3,043,527) |
|
(Increase) / decrease in prepaid expenses and other assets |
|
(2,189,791) |
|
1,608,673 |
|
(2,540,271) |
|
Increase in VAT recoverable |
|
(3,015,088) |
|
(118,200) |
|
(1,217,751) |
|
Increase /(decrease) in current liabilities |
|
4,372,122 |
|
(2,595,696) |
|
6,371,925 |
|
|
|
|
|
|
|
|
|
Net cash used in operating activities |
|
(1,877,144) |
|
(834,908) |
|
(1,415,004) |
|
|
|
|
|
|
|
|
|
CASH FLOWS FROM INVESTING ACTIVITIES: |
|
|
|
|
|
|
|
Acquisition of oil and gas properties |
6 |
(37,483,825) |
|
(17,759,232) |
|
(17,411,861) |
|
Acquisition of other fixed assets |
7 |
(824,974) |
|
(566,840) |
|
(549,045) |
|
Proceeds from sale of fixed assets |
|
68,955 |
|
|
|
|
|
Increase in construction in progress |
8 |
(4,463,063) |
|
- |
|
- |
|
Increase in restricted cash |
|
(147,243) |
|
(95,481) |
|
(40,973) |
|
|
|
|
|
|
|
|
|
Net cash used in investing activities |
|
(42,850,150) |
|
(18,421,553) |
|
(18,001,879) |
|
|
|
|
|
|
|
|
|
CASH FLOWS FROM FINANCING ACTIVITIES: |
|
|
|
|
|
|
|
Proceeds from sale of common stock |
|
- |
|
57,410,892 |
|
27,280,160 |
|
Proceeds from exercise of common stock options and warrants |
13 |
5,758,502 |
|
2,997,669 |
|
- |
|
|
|
|
|
|
|
|
|
Net cash provided by financing activities |
|
5,758,502 |
|
60,408,561 |
|
27,280,160 |
|
|
|
|
|
|
|
|
|
NET CHANGE IN CASH AND CASH EQUIVALENTS |
|
(38,968,792) |
|
41,152,100 |
|
7,863,277 |
|
CASH AND CASH EQUIVALENTS at beginning of year |
|
51,141,732 |
|
10,778,553 |
|
2,126,355 |
|
CASH AND CASH EQUIVALENTS at end of year |
|
$ 12,172,940 |
|
$ 51,141,732 |
|
$ 9,989,632 |
|
|
|
|
|
|
|
|
See notes to the consolidated financial statements.
F-6
BMB MUNAI, INC.
CONSOLIDATED STATEMENTS OF CASH FLOWS (CONTINUED)
|
|
|
Year ended March 31, 2007 |
|
Year ended March 31, 2006 |
|
Year ended March 31, 2005 |
|
Non-Cash Investing and Financing Activities |
|
|
|
|
|
|
|
Asset retirement obligation incurred in property development |
|
$ 1,067,718 |
|
$ 858,017 |
|
$ - |
|
Common stock issued for ownership percentage in subsidiary |
|
- |
|
- |
|
19,075,000 |
|
Deferred tax liability incurred in non-taxable business combination of subsidiary |
|
813,934 |
|
- |
|
6,405,285 |
|
|
|
|
|
|
|
|
See notes to the consolidated financial statements.
F-7
BMB MUNAI, INC.
NOTES TO THE CONSOLIDATED FINANCIAL STATEMENTS
NOTE 1 - DESCRIPTION OF BUSINESS
The corporation now known as BMB Munai, Inc., (“BMB Munai” or the “Company”) was originally incorporated in Utah in July 1981. On February 7, 1994, the corporation changed its name to InterUnion Financial Corporation (“InterUnion”) and its domicile to Delaware. BMB Holding, Inc. (“BMB Holding”) was incorporated on May 6, 2003 for the purpose of acquiring and developing oil and gas fields in the Republic of Kazakhstan. On November 26, 2003, InterUnion executed an Agreement and Plan of Merger (the “Agreement”) with BMB Holding. As a result of the merger, the shareholders of BMB Holding obtained control of the corporation. BMB Holding was treated as the acquiror for accounting purposes. A new board of directors was elected that was comprised primarily of the former directors of BMB Holding and the name of the corporation was changed to BMB Munai, Inc.
The Company’s consolidated financial statements presented are a continuation of BMB Holding, and not those of InterUnion Financial Corporation, and the capital structure of the Company is now different from that appearing in the historical financial statements of InterUnion Financial Corporation due to the effects of the recapitalization.
The Company has a representative office in Almaty, Republic of Kazakhstan.
From inception (May 6, 2003) through January 1, 2006 the Company had minimal operations and was considered to be in the development stage. From January 1, 2006 the Company started to generate significant revenues and is no longer in the development stage.
If the Company is unable to drill and complete a sufficient number of wells in each of its identified structures to support its claim of commercially producible reserves before the end of the term of its exploration contract, as extended, the Company may not be granted a commercial production contract for each of its structures.
In order to obtain a commercial production license for the structures contained within the Company’s licensed territory, it must engage in sufficient exploration, drilling and testing activities to gather adequate data to support its claims that it has discovered commercial producible reserves within its contract territory. These activities must be completed during the term of the exploration license. It is generally accepted that one exploratory and two appraisal wells are sufficient to determine whether a license holder has discovered a commercially producible reserve, although in some instances, license holders are able to establish commercially producible reserves with fewer than three wells. Currently the Company has completed nine wells with an additional three wells in progress. As discussed in more details in Note 2, at March 31, 2007, the Company has not yet applied for or been granted a commercial production license.
F-8
BMB MUNAI, INC.
NOTES TO THE CONSOLIDATED FINANCIAL STATEMENTS
NOTE 2 - SIGNIFICANT ACCOUNTING POLICIES
Basis of consolidation
The Company’s consolidated financial statements present the consolidated results of BMB Munai, Inc., and its wholly owned subsidiary, Emir Oil LLP (hereinafter collectively referred to as the “Company”). All significant inter-company balances and transactions have been eliminated from the Consolidated Financial Statements.
Use of estimates
The preparation of Consolidated Financial Statements in conformity with US GAAP requires management to make estimates and assumptions that affect certain reported amounts of assets and liabilities and the disclosures of contingent assets and liabilities at the date of the Consolidated Financial Statements and revenues and expenses during the reporting period. Accordingly, actual results could differ from those estimates and affect the results reported in these Consolidated Financial Statements.
Licenses and contracts
Emir Oil LLP is the operator of the Aksaz, Dolinnoe and Emir oil and gas fields in western Kazakhstan (the “ADE Block”, the “ADE Fields”). The Government of the Republic of Kazakhstan (the “Government”) initially issued the license to Zhanaozen Repair and Mechanical Plant on April 30, 1999. On June 9, 2000, the contract for exploration of the Aksaz, Dolinnoe and Emir oil and gas fields was entered into between the Agency of the Republic of Kazakhstan on Investments and the Zhanaozen Repair and Mechanical Plant. On September 23, 2002, the contract was assigned to Emir Oil LLP. On September 10, 2004 the Government extended the term of the Contract for exploration and License from five years to seven years through July 9, 2007. On February 27, 2007, the Ministry of Energy and Mineral Resources of the Republic of Kazakhstan (MEMR) granted a second extension of Company’s exploration contract. Under the terms of the contract extension, the exploration period will extend to July 2009 over entire exploration contract territory. On December 7, 2004 the Government assigned to Emir Oil LLP exclusive right to explore the additional territory during the remaining term of the License. To move from the exploration and development stage to the commercial production stage, the Company must apply for and be granted a commercial production contract. The Company is legally entitled to receive this commercial production contract and has an exclusive right to negotiate this Contract and the Government is obligated to conduct these negotiations under the Law of Petroleum in Kazakhstan. If the Company does not move from the exploration and development stage to the commercial production stage, it has the right to produce and sell oil, including export oil, under the Law of Petroleum for the term of its existing contract.
F-9
BMB MUNAI, INC.
NOTES TO THE CONSOLIDATED FINANCIAL STATEMENTS
Foreign currency translation
Transactions denominated in foreign currencies are reported at the rates of exchange prevailing at the date of the transaction. Monetary assets and liabilities denominated in foreign currencies are translated to U.S. dollars at the rates of exchange prevailing at the balance sheet dates. Any gains or losses arising from a change in exchange rates subsequent to the date of the transaction are included as an exchange gain or loss in the Consolidated Statements of Operations.
Share-based compensation
The Company accounts for options granted to non-employees at their fair value in accordance with SFAS No. 123R, Share Based Payment and EITF Abstracts Issue 96-18, Accounting for Equity Instruments That Are Issued to Other Than Employees for Acquiring, or in Conjunction with Selling, Goods or Services. Under SFAS No. 123R, share-based compensation is determined as the fair value of the equity instruments issued. The measurement date for these issuances is the earlier of the date at which a commitment for performance by the recipient to earn the equity instruments is reached or the date at which the recipient’s performance is complete. Stock options granted to the “selling agents” in the private equity placement transactions have been offset to the proceeds as a cost of capital. Stock options and stocks granted to other non-employees are recognized in the Consolidated Statements of Operations.
The Company has a stock option plan as described in Note 13. Compensation expense for options and stocks granted to employees is determined based on their fair values at the time of grant, the cost of which is recognized in the Consolidated Statements of Operations over the vesting periods of the respective options.
Risks and uncertainties
The ability of the Company to realize the carrying value of its assets is dependent on being able to develop, transport and market oil and gas. Currently exports from the Republic of Kazakhstan are primarily dependent on transport routes either via rail, barge or pipeline, through Russian territory. Domestic markets in the Republic of Kazakhstan historically and currently do not permit world market price to be obtained. However, management believes that over the life of the project, transportation options will improve as additional pipelines and rail-related infrastructure is built that will increase transportation capacity to the world markets.
Recognition of revenue and cost
Revenue and associated costs from the sale of oil are charged to the period when persuasive evidence of an arrangement exists, the price to the buyer is fixed or determinable, collectibility is reasonably assured, delivery of oil has occurred or when ownership title transferred. Produced but unsold products are recorded as inventory until sold.
F-10
BMB MUNAI, INC.
NOTES TO THE CONSOLIDATED FINANCIAL STATEMENTS
Income taxes
The Company accounts for income taxes using the liability method. Under the liability method, deferred tax assets and liabilities are recognized for the future tax consequences attributable to differences between financial statement carrying amounts of existing assets and liabilities and their respective tax bases. Deferred tax assets and liabilities are measured using enacted tax rates expected to apply to taxable income in the years in which those temporary differences are expected to be recovered or settled. Under the liability method, the effect on previously recorded deferred tax assets and liabilities resulting from a change in tax rates is recognized in earnings in the period in which the change is enacted.
Cash and cash equivalents
The Company considers all demand deposits, money market accounts and marketable securities purchased with an original maturity of three months or less to be cash and cash equivalents. The fair value of cash and cash equivalents approximates their carrying amounts due to their short-term maturity.
Prepaid expenses and other assets
Prepaid expenses and other assets are stated at their net realizable values after deducting provisions for uncollectible amounts. Such provisions reflect either specific cases or estimates based on evidence of collectibility. The fair value of prepaid expense and other asset accounts approximates their carrying amounts due to their short-term maturity.
Inventories
Inventories of equipment for development activities, tangible drilling materials required for drilling operations, spare parts, diesel fuel, and various materials for use in oil field operations are recorded at the lower of cost and net realizable value. Under the full cost method, inventory is transferred to oil and gas properties when used in exploration, drilling and development operations in oilfields.
Inventories of crude oil are recorded at the lower of cost or net realizable value. Cost comprises direct materials and, where applicable, direct labor costs and overhead, which has been incurred in bringing the inventories to their present location and condition. Cost is calculated using the weighted average method. Net realizable value represents the estimated selling price less all estimated costs to completion and costs to be incurred in marketing, selling and distribution.
F-11
BMB MUNAI, INC.
NOTES TO THE CONSOLIDATED FINANCIAL STATEMENTS
The Company periodically assesses its inventories for obsolete or slow moving stock and records an appropriate provision, if there is any. The Company has assessed its inventory at March 31, 2007.
No provision for obsolete inventory has been provided.
Oil and gas properties
The Company follows the full cost method of accounting for its costs of acquisition, exploration and development of oil and gas properties.
Under full cost accounting rules, the net capitalized costs of evaluated oil and gas properties shall not exceed an amount equal to the present value of future net cash flows from estimated production of proved oil and gas reserves, based on current economic and operating conditions, including the use of oil and gas prices as of the end of the period.
Given the volatility of oil and gas prices, it is reasonably possible that the estimate of discounted future net cash flows from proved oil and gas reserves could change. If oil and gas prices decline, even if only for a short period of time, it is possible that impairments of oil and gas properties could occur. In addition, it is reasonably possible that impairments could occur if costs are incurred in excess of any increases in the cost ceiling, revisions to proved oil and gas reserves occur, or if properties are sold for proceeds less than the discounted present value of the related proved oil and gas reserves.
All geological and geophysical studies, with respect to the licensed territory, have been capitalized as part of the oil and gas properties.
The Company’s oil and gas properties primarily include the value of the license and other capitalized costs.
Depletion of producing properties is computed using the unit-of-production method based on estimated proved reserves.
Liquidation fund
Liquidation fund (site restoration and abandonment liability) is related primarily to the conservation and liquidation of the Company’s wells and similar activities related to its oil and gas properties, including site restoration. Management assessed an obligation related to these costs with sufficient certainty based on internally generated engineering estimates, current statutory requirements and industry practices. The Company recognized the estimated fair value of this liability. These estimated costs were recorded as an increase in the cost of oil and gas assets with a corresponding increase in the liquidation fund. The oil and gas assets related to
F-12
BMB MUNAI, INC.
NOTES TO THE CONSOLIDATED FINANCIAL STATEMENTS
liquidation fund are depreciated on the unit-of-production basis separately for each field. An accretion expense, resulting from the changes in the liability due to passage of time by applying an interest method of allocation to the amount of the liability, is recorded as accretion expenses in the Consolidated Statement of Operations.
The adequacies of the liquidation fund are periodically reviewed in the light of current laws and regulations, and adjustments made as necessary.
Other fixed assets
Other fixed assets are valued at historical cost adjusted for impairment loss less accumulated depreciation. Historical cost includes all direct costs associated with the acquisition of the fixed assets.
Depreciation of other fixed assets is calculated using the straight-line method based upon the following estimated useful lives:
|
|
|
|
Buildings and improvements |
7-10 years |
|
Machinery and equipment |
6-10 years |
|
Vehicles |
3-5 years |
|
Office equipment |
3-5 years |
|
Software |
3-4 years |
|
Furniture and fixtures |
2-7 years |
Maintenance and repairs are charged to expense as incurred. Renewals and betterments are capitalized.
Other fixed assets of the Company are evaluated for impairment. If the sum of expected undiscounted cash flows is less than net book value, unamortized costs of other fixed assets will be reduced to a fair value.
Restricted cash
Restricted cash includes funds deposited in a Kazakhstan bank and is restricted to meet possible environmental obligations according to the regulations of the Republic of Kazakhstan.
Functional currency
The Company makes its principal investing and financing transactions in United States Dollars and the United States Dollar is therefore its functional currency.
F-13
BMB MUNAI, INC.
NOTES TO THE CONSOLIDATED FINANCIAL STATEMENTS
Reclassifications
Certain reclassifications have been made in the financial statements for the year ended March 31, 2006 to conform to the March 31, 2007 presentation. The reclassifications had no effect on net income.
Concentrations of Credit Risk and Accounts Receivable
The Company exports all of its test production for sale in the world market. Currently, all of production is being sold to one client, Euro-Asian Oil AG. In the exploration, development and production business, production is normally sold to relatively few customers. Our customers are concentrated in the oil and gas industry, and revenue can be materially affected by current economic conditions and the price of certain commodities such as natural gas and crude oil the cost of which is passed through to the customer. All of the Company’s accounts receivable are from Euro-Asian Oil AG. Oil sales are unsecured, however, the Company has not had any credit losses in the past and believes its accounts receivable are fully collectible. Accordingly, no allowance for doubtful accounts has been provided.
Recent accounting pronouncements
In June 2006, the FASB issued FASB Interpretation No. 48 “Accounting for Uncertainty in Income Taxes, an interpretation of FASB Statement No. 109”. This interpretation clarifies the accounting for uncertainty in income taxes recognized in an enterprise’s financial statements in accordance with FASB No. 109 “Accounting for Income taxes”. This interpretation is effective for the fiscal years beginning after December 15, 2006. Management does not anticipate this Statement will impact the Company’s consolidated financial position or consolidated results of operations and cash flows.
In September 2006, the FASB issued Statement No. 157, “Fair Value Measurements” This Statement defines fair value, establishes a framework for measuring fair value in generally accepted accounting principles (GAAP), and expands disclosures about fair value measurements. This Statement applies under other accounting pronouncements that require or permit fair value measurements, the Board having previously concluded in those accounting pronouncements that fair value is the relevant measurement attribute. This Statement is effective for financial statements issued for the fiscal years beginning after November 15, 2007. Management does not anticipate this Statement will impact the Company’s consolidated financial position or consolidated results of operations and cash flows.
In September 2006, the FASB issued Statement No. 158, “Employers’ Accounting for Defined Benefit Pension and Other Postretirement Plans”, an amendment of FASB Statements No. 87, 88, 106, and 132(R). This Statement improves financial reporting by requiring an employer to recognize the overfunded or underfunded status of a defined benefit postretirement plan (other than a multiemployer plan) as
F-14
BMB MUNAI, INC.
NOTES TO THE CONSOLIDATED FINANCIAL STATEMENTS
an asset or liability in its statement of financial position and to recognize changes in that funded status in the year in which the changes occur through comprehensive income of a business entity or changes in unrestricted net assets of a not-for-profit organization. This Statement is effective for employers with publicly traded equity securities is required to initially recognize the funded status of a defined benefit postretirement plan and to provide the required disclosures as of the end of the fiscal year ending after December 15, 2006. Management belives this Statement has no material impact the Company’s consolidated financial position or consolidated results of operations and cash flows.
In September 2006, the SEC staff issued Staff Accounting Bulletin (SAB) Topic 1N, “Financial Statements - Considering the Effects of Prior Year Misstatements when Quantifying Misstatements in Current Year Financial Statements” ( SAB 108). The SEC staff is providing guidance on how prior year misstatements should be taken into consideration when quantifying misstatements in current year financial statements for purposes of determining whether the current year’s financial statements are materially misstated and should be restated. SAB 108 is effective for fiscal years ending after November 15, 2006. The company does not believe SAB 108 has a material impact on its results of operations, financial condition and cash flows.
In September 2006, the EITF issued EITF Abstracts Issue No. 06-3 (EITF 06-3). The EITF is providing guidance on how taxes collected from customers and remitted to Governmental Authorities should be presented in the income statements. EITF 06-3 is effective for interim and annual periods beginning after December 15, 2006. The company does not anticipate EITF 06-3 will have a material impact on its results of operations, financial condition and cash flows.
In February 2007, the FASB issued Statement No. 159, “The Fair Value Option for Financial Assets and Financial Liabilities—Including an amendment of FASB Statement No. 115”. This Statement permits entities to choose to measure many financial instruments and certain other items at fair value. The objective is to improve financial reporting by providing entities with the opportunity to mitigate volatility in reported earnings caused by measuring related assets and liabilities differently without having to apply complex hedge accounting provisions. This Statement is expected to expand the use of fair value measurement, which is consistent with the Board’s long-term measurement objectives for accounting for financial instruments. This Statement is effective for financial statements issued for the fiscal years beginning after November 15, 2007. Management does not anticipate this Statement will impact the Company’s consolidated financial position or consolidated results of operations and cash flows.
F-15
BMB MUNAI, INC.
NOTES TO THE CONSOLIDATED FINANCIAL STATEMENTS
NOTE 3 - CASH AND CASH EQUIVALENTS
As of March 31, 2007 and 2006 cash and cash equivalents included:
|
|
March 31, 2007 |
|
March 31, 2006 |
|
|
|
|
|
|
US Dollars |
$ 8,577,949 |
|
$ 50,959,064 |
|
Foreign currency |
3,594,991 |
|
182,668 |
|
|
$ 12,172,940 |
|
$ 51,141,732 |
As of March 31, 2007, cash and cash equivalents included $7,702,483 placed in money market funds having a 30 day simple yield of 4.99%.
As of March 31, 2006, cash and cash equivalents included $11,100,262 placed in money market funds having a 30 day simple yield of 4.28%.
As of March 31, 2006, cash and cash equivalents included short-term debt securities in the amount of $33,095,609. The short-term debt securities consisted of discount bonds issued by General Electric Corporation and discount notes issued by Fannie Mae.
As of March 31, 2007 and 2006 cash and cash equivalents included $292,679 and $324,621, respectively, of letters of credit opened for the purpose of purchasing production equipment.
NOTE 4 - INVENTORIES
As of March 31, 2007 and 2006 inventories included:
|
|
March 31, 2007 |
|
March 31, 2006 |
|
|
|
|
|
|
Construction material |
$ 10,051,888 |
|
$ 3,069,144 |
|
Spare parts |
31,804 |
|
13,486 |
|
Crude oil produced |
4,810 |
|
8,840 |
|
Other |
246,194 |
|
148,477 |
|
|
$ 10,334,696 |
|
$ 3,239,947 |
F-16
BMB MUNAI, INC.
NOTES TO THE CONSOLIDATED FINANCIAL STATEMENTS
NOTE 5 - PREPAID EXPENSES AND OTHER ASSETS
Prepaid expenses and other assets as of March 31, 2007 and 2006, were as follows:
|
|
March 31, 2007 |
|
March 31, 2006 |
|
|
|
|
|
|
Advances for services |
$ 2,016,177 |
|
$ 452,839 |
|
Other |
255,322 |
|
309,533 |
|
|
|
|
|
|
Reserves against uncollectible advances and prepayments |
(211,475) |
|
(195,452) |
|
|
$ 2,060,024 |
|
$566,920 |
NOTE 6 - OIL AND GAS PROPERTIES
Oil and gas properties using the full cost method as of March 31, 2007 and 2006, were as follows:
|
|
March 31, 2007 |
|
March 31, 2006 |
|
|
|
|
|
|
Cost of drilling wells |
$ 33,263,035 |
|
$ 14,895,604 |
|
Subsoil use rights |
20,788,119 |
|
20,788,119 |
|
Material and fuel used in exploration and development activities |
16,417,280 |
|
6,840,976 |
|
Professional services received in exploration and
development |
16,179,937 |
|
10,600,327 |
|
Deferred tax |
7,219,219 |
|
6,405,285 |
|
Geological and geophysical |
2,803,215 |
|
1,432,418 |
|
Infrastructure development costs |
1,753,222 |
|
1,412,999 |
|
Other capitalized costs |
9,167,016 |
|
5,704,210 |
|
|
|
|
|
|
Accumulated depletion |
(3,403,475) |
|
(1,396,641) |
|
|
$ 104,187,568 |
|
$ 66,683,297 |
The purchase of Emir Oil LLP (see Note 13) has been accounted for as a non-taxable business combination. Since goodwill was not recognized in this stock based subsidiary acquisition involving oil and gas properties, a recognition of a deferred tax liability related to the acquisition increases the financial reporting basis of the oil and gas properties.
F-17
BMB MUNAI, INC.
NOTES TO THE CONSOLIDATED FINANCIAL STATEMENTS
NOTE 7 - OTHER FIXED ASSETS
|
|
Buildings and improvements |
|
Machinery and equipment |
|
Vehicles |
|
Office equipment |
|
Furniture and fixtures |
|
Software |
|
Total |
|
Cost |
|
|
|
|
|
|
|
|
|
|
|
|
|
|
at March 31, 2006 |
$ 149,272 |
|
$ 372,427 |
|
$ 432,121 |
|
$ 206,890 |
|
$ 148,645 |
|
76,257 |
|
$ 1,385,612 |
|
Additions |
176,979 |
|
178,939 |
|
319,981 |
|
74,263 |
|
70,149 |
|
4,663 |
|
824,974 |
|
Disposals |
- |
|
- |
|
(72,909) |
|
(3,356) |
|
(16,961) |
|
- |
|
(93,226) |
|
at March 31, 2007 |
326,251 |
|
551,366 |
|
679,193 |
|
277,797 |
|
201,833 |
|
80,920 |
|
2,117,360 |
|
|
|
|
|
|
|
|
|
|
|
|
|
|
|
|
Accumulated depreciation |
|
|
|
|
|
|
|
|
|
|
|
|
|
|
at March 31, 2006 |
24,922 |
|
26,187 |
|
152,719 |
|
51,650 |
|
32,926 |
|
26,601 |
|
315,005 |
|
Charge for the period |
25,224 |
|
34,140 |
|
134,255 |
|
66,469 |
|
30,157 |
|
25,992 |
|
316,237 |
|
Disposals |
- |
|
- |
|
(27,166) |
|
(1,302) |
|
(4,537) |
|
- |
|
(33,005) |
|
at March 31, 2007 |
50,146 |
|
60,327 |
|
259,808 |
|
116,817 |
|
58,546 |
|
52,593 |
|
598,237 |
|
|
|
|
|
|
|
|
|
|
|
|
|
|
|
|
Net book value at March 31, 2006 |
$ 124,350 |
|
$ 346,240 |
|
$ 279,402 |
|
$ 155,240 |
|
$ 115,719 |
|
49,656 |
|
$ 1,070,607 |
|
|
|
|
|
|
|
|
|
|
|
|
|
|
|
|
Net book value at March 31, 2007 |
$ 276,105 |
|
$ 491,039 |
|
$ 419,385 |
|
$ 160,980 |
|
$ 143,287 |
|
28,327 |
|
$ 1,519,123 |
In accordance with SFAS No. 19, Financial Accounting and Reporting by Oil and Gas Producing Companies, depreciation related to support equipment and facilities used in exploration and development activities in the amount of $145,627 was capitalized to oil and gas properties for the year ended March 31, 2007.
NOTE 8 - CONSTRUCTION IN PROGRESS
On April 13, 2006 the Company entered into the Agreement on Joint Business
(the “Agreement”) with Ecotechnic Chemicals AG incorporated in Switzerland, ( “Ecotechnic”) for construction of facility on utilization of associated gas on the Company’s fields (the “Facility”). After completion of the Facility construction, the Company and Ecotechnic will sign the agreement on the formation of a joint venture company, which will operate the Facility.
In accordance with terms of the Agreement, the Company has made payments of
USD $4,463,063 for development of project documentation, purchase of equipment, transportation and customs, and construction of a gas pipe-line.
NOTE 9 - LONG TERM VAT RECOVERABLE
As of March 31, 2007 and 2006 the Company had long term VAT recoverable in the amount of $4,351,059 and $1,335,971, respectively. The VAT recoverable is a Tenge denominated asset due from the Republic of Kazakhstan. The VAT
F-18
BMB MUNAI, INC.
NOTES TO THE CONSOLIDATED FINANCIAL STATEMENTS
recoverable consists of VAT paid on local expenditures and imported goods. VAT charged to the Company is recoverable in future periods as either cash refunds or offsets against the Company’s fiscal obligations, including future income tax liabilities. Management believes that this asset will not be realized in the current year because in order to return funds or offset this tax with other taxes a tax examination must be performed by local Kazakhstan tax authorities. This examination is not expected to be completed in the following year.
NOTE 10 - RESTRICTED CASH
Under the laws of the Republic of Kazakhstan, the Company is obligated to set aside funds for required environmental remediation. As of March 31, 2007 and 2006 the Company has amounts of $303,697 and $156,454, respectively, restricted for this purpose.
NOTE 11 - LIQUIDATION FUND
A reconciliation on the Liquidation Fund (Asset Retirement Obligation) at March 31, 2007, 2006 and 2005 is as follows:
|
|
Total |
|
|
|
|
At March 31, 2005 |
$ 60,973 |
|
|
|
|
Revision of estimation |
699,174 |
|
Accrual of liability |
158,843 |
|
Accretion expense |
5,602 |
|
|
|
|
At March 31, 2006 |
924,592 |
|
|
|
|
Accrual of liability |
1,067,718 |
|
Accretion expenses |
173,519 |
|
|
|
|
At March 31, 2007 |
$ 2,165,829 |
Management believes that the liquidation fund should be accrued for future abandonment costs of 10 wells located in the Dolinnoe, Aksaz, Emir and Kariman oil fields. Management believes that these obligations are likely to be settled at the end of the production phase at these oil fields.
At March 31, 2007, undiscounted expected future cash flows that will be required to satisfy the Company’s obligation by 2007 for the Dolinnoe, Aksaz and Emir fields, respectively, are $2,355,006. After application of a 10% discount rate, the present value of the Company’s liability at March 31, 2007 and 2006, is $2,165,829 and $924,592, respectively.
F-19
BMB MUNAI, INC.
NOTES TO THE CONSOLIDATED FINANCIAL STATEMENTS
NOTE 12 - INCOME TAXES
The income tax charge in the Consolidated Statements of Operations is comprised of:
|
|
Year ended March 31, 2007 |
|
Year ended March 31, 2006 |
|
Year ended March 31, 2005 |
|
|
|
|
|
|
|
|
|
|
Current tax expense |
$ 124,202 |
|
$ - |
|
$ - |
|
|
Deferred tax expense |
729,078 |
|
35,043 |
|
343 |
|
|
|
$ 853,280 |
|
$ 35,043 |
|
$ 343 |
|
The relationship between tax expenses and accounting income for the years ended March 31, 2007, 2006 and 2005 is explained as follows:
|
|
Year ended March 31, 2007 |
|
Year ended March 31, 2006 |
|
Year ended March 31, 2005 |
|
|
|
|
|
|
|
|
|
|
Income / (loss) before income taxes |
$ 1,892,771 |
|
$ (5,309,290) |
|
$ (3,285,969) |
|
|
|
|
|
|
|
|
|
|
Expected tax provision |
643,542 |
|
(1,592,787) |
|
(985,791) |
|
|
|
|
|
|
|
|
|
|
Local tax, current |
124,202 |
|
- |
|
- |
|
|
Non-deductible expenses |
32,322 |
|
2,077,723 |
|
976,961 |
|
|
Other |
53,214 |
|
(449,893) |
|
9,173 |
|
|
|
$ 853,280 |
|
$ 35,043 |
|
$ 343 |
|
As of March 31, 2007, the Company had net operating loss carry forwards for income tax purposes of $8,866,813, which if unused, will expire in 2024, 2025, 2026 and 2027.
F-20
BMB MUNAI, INC.
NOTES TO THE CONSOLIDATED FINANCIAL STATEMENTS
Deferred taxes reflect the estimated tax effect of temporary differences between assets and liabilities for financial reporting purposes and those measured by tax laws and regulations. The components of deferred tax assets and deferred tax liabilities are as follows:
|
|
March 31, 2007 |
|
March 31, 2006 |
|
|
|
|
|
|
Deferred tax assets: |
|
|
|
|
Stock based compensation |
$ 185,418 |
|
$ - |
|
Liquidation fund |
100,673 |
|
- |
|
Tax losses carried forward |
3,014,716 |
|
593,122 |
|
|
3,300,807 |
|
593,122 |
|
Deferred tax liabilities: |
|
|
|
|
Oil and gas properties |
10,361,091 |
|
6,636,522 |
|
Accrued interest income |
888,013 |
|
361,885 |
|
|
11,249,104 |
|
6,998,407 |
|
Net deferred tax liability |
$ 7,948,297 |
|
$ 6,405,285 |
Deferred income taxes for US and Kazakhstan tax jurisdiction are as follows:
|
|
March 31, 2007 |
|
March 31, 2006 |
||||
|
|
US tax jurisdiction |
|
Kazakhstan tax jurisdiction |
|
US tax jurisdiction |
|
Kazakhstan tax jurisdiction |
|
|
|
|
|
|
|
|
|
|
Deferred tax assets: |
|
|
|
|
|
|
|
|
Stock based compensation |
$ 185,418 |
|
$ - |
|
$ - |
|
$ - |
|
Liquidation fund |
- |
|
100,673 |
|
- |
|
- |
|
Tax losses carried forward |
3,014,716 |
|
- |
|
583,329 |
|
9,793 |
|
|
3,200,134 |
|
100,673 |
|
583,329 |
|
9,793 |
|
Deferred tax liabilities: |
|
|
|
|
|
|
|
|
Oil and gas properties |
6,990,851 |
|
3,370,240 |
|
6,369,899 |
|
266,623 |
|
Accrued interest income |
888,013 |
|
- |
|
361,885 |
|
- |
|
|
7,878,864 |
|
3,370,240 |
|
6,731,784 |
|
266,623 |
|
|
|
|
|
|
|
|
|
|
Net deferred tax liability |
$ 4,678,730 |
|
$ 3,269,567 |
|
$ 6,148,455 |
|
$ 256,830 |
A deferred tax liability from oil and gas properties for the US tax jurisdiction was also recorded during this year. This liability resulted from a temporary difference related to the oil and gas basis from the non-taxable business combination with Emir Oil LLP (see Note 6).
F-21
BMB MUNAI, INC.
NOTES TO THE CONSOLIDATED FINANCIAL STATEMENTS
NOTE 13 - SHARE AND ADDITIONAL PAID IN CAPITAL
Common and preferred stock as of March 31, 2007 and 2006 were as follows:
|
|
March 31, 2007 |
|
March 31, 2006 |
|
Preferred stock, $0.001 par value |
|
|
|
|
Authorized |
20,000,000 |
|
20,000,000 |
|
Issued and outstanding |
- |
|
- |
|
|
|
|
|
|
Common stock, $0.001 par value |
|
|
|
|
Authorized |
500,000,000 |
|
100,000,000 |
|
Issued and outstanding |
44,690,657 |
|
42,223,685 |
On June 21, 2006, the Company filed a Certificate of Amendment to the BMB Munai, Inc. Articles of Incorporation with the Nevada Secretary of State to increase the Company’s authorized common stock from 100,000,000 to 500,000,000 shares. Authorized preferred stock remained unchanged.
Acquisition
On May 24, 2004, the Company agreed to purchase the remaining 30% interest of its minority interest partner in Emir Oil LLP in exchange for 3,500,000 shares of restricted Company common stock. On August 6, 2004, the Company issued the 3,500,000 shares to its minority partner in Emir Oil LLP. The aggregate purchase price was determined to be $19,075,000 using a price of the Company’s common shares on OTCBB on August 6, 2004 of $5.45 per share. The entire purchase price has been allocated to oil and gas properties in the accompanying Consolidated Balance Sheets.
Private placements
On July 2, 2004, the Company sold an aggregate of 4,584,340 common shares of the Company at $4.00 per share in a private placement offering. The Company received $17,311,906, net of the agent fees and out of pocket expenses.
On March 9, 2005, the Company sold an aggregate of 2,000,000 common shares of the Company at $5.00 per share in a private placement offering. The Company received $9,968,254, net of the agent fees and out of pocket expenses.
On March 31, 2005, the Company sold an aggregate of 1,101,000 common shares of the Company at $5.00 per share in a private placement offering. On April 12, 2005, the Company received $5,221,685, net of the agent fees and out of pocket expenses.
On December 23, 2005, the Company sold an aggregate of 9,166,667 common shares of the Company at $6.00 per share in a private placement offering. On December 29, 2005, the Company received $52,189,207, net of the agent fees and out of pocket expenses.
F-22
BMB MUNAI, INC.
NOTES TO THE CONSOLIDATED FINANCIAL STATEMENTS
Common stock sold in private placements as of March 31, 2007 is as follows:
|
|
Number of shares sold |
|
Share price |
|
Gross amount raised |
|
Net amount received |
|
|
|
|
|
|
|
|
|
|
First private placement |
4,830,494 |
|
$ 2.15-$ 2.50 |
|
$ 11,113,562 |
|
$ 9,935,874 |
|
Second private placement |
4,584,340 |
|
$ 4.00 |
|
18,337,360 |
|
17,311,906 |
|
Third private placement |
3,101,000 |
|
$ 5.00 |
|
15,505,000 |
|
15,189,939 |
|
Fourth private placement |
9,166,667 |
|
$ 6.00 |
|
55,000,002 |
|
52,189,207 |
|
|
21,682,501 |
|
|
|
$ 99,955,924 |
|
$ 94,626,926 |
The offerings were made only to accredited investors in the United States of America under Regulation D and pursuant to Regulation S to non-U.S. Persons.
Share-Based Compensation
During the fiscal year ended March 31, 2005 the shareholders of the Company approved an incentive stock option plan (the “Plan”) under which directors, officers and key personnel may be granted options to purchase common shares of the Company, as well as other stock based awards. 5,000,000 common shares were reserved for issuance under the Plan. The Board determines the terms of options and other awards made under the Plan. Under the terms of the Plan, no incentive stock options shall be granted with an exercise price at a discount to the market.
Common Stock
On July 18, 2005, the Company granted 90,000 restricted common shares to three Company employees. Each employee’s stock grants vest in three equal tranches of 10,000 shares on the first, second and third anniversaries of their employment with the Company. We record the fluctuations in the fair value of certain unvested stock grants as a deferred compensation asset (reported as a reduction of shareholders’ equity on the balance sheet). This asset is amortized upon vesting of related stock grants as non-cash compensation expense. Compensation expense for vested stock grants in the amount of $124,477 has been recognized in the Consolidated Statement of Operations and Consolidated Balance Sheet for the year ended March 31, 2007.
As of March 31, 2007, there was $31,523 of total unrecognized compensation expense related to non-vested share-based compensation arrangements granted under the Plan. That cost is expected to be recognized over a weighted-average period of 0.6 years.
On July 18, 2005, the Company granted common shares to Company’s directors and officers for past services rendered. The number of shares granted was 360,270. The shares were valued at $4.75 per share. This stock grant vested immediately. Compensation expense in the amount of $1,711,283 was recognized in the
F-23
BMB MUNAI, INC.
NOTES TO THE CONSOLIDATED FINANCIAL STATEMENTS
Consolidated Statements of Operations and Consolidated Balance Sheet for the year ended March 31, 2006.
On July 18, 2005, the Company also granted common shares to legal counsel, for the legal services rendered. The number of such stock grants has been set at 18,947 shares at the price of $4.75 per share. Stock grants vest immediately. Expense in the amount of $89,998 was recognized in the Consolidated Statements of Operations and Consolidated Balance Sheet for the year ended March 31, 2006.
During the quarter ended September 30, 2005, the Company granted restricted common shares to the Company’s former co-chief executive officer and president for services rendered. He was granted 70,526 shares. The shares were valued at $5.02 per share. The stock grants vested immediately. Compensation expense in the amount of $354,041 was recognized in the Consolidated Statements of Operations and Consolidated Balance Sheet for the year ended March 31, 2006.
On February 1, 2006, the Company also granted common shares to the Company’s former chief finance officer for the services rendered. He was granted 50,000 shares. The shares were valued at $7.4 per share. The stock grants vested immediately. Compensation expense in the amount of $370,000 was recognized in the Consolidated Statement of Operations and Consolidated Balance Sheet for the year ended March 31, 2006.
On June 20, 2006, the Company granted common stock to officers and directors and certain employees and consultants of the Company under the Plan. The total number of restricted common shares granted was 495,000. The restricted stock grants were valued at $7.00 per share. All of the restricted stock grants vested immediately upon grant. Compensation expense in the amount of $3,465,000 was recognized in the Consolidated Statements of Operations and Consolidated Balance Sheet.
On March 30, 2007, the Company granted common stock to officers, employees and outside consultants of the Company under the Plan. The total number of restricted common shares granted was 950,000. The restricted stock grants were valued at $5.38 per share. The restricted stock grants were awarded on the same terms and subject to same vesting requirements. The restricted stock grants will vest to the grantees at such time as either of the following events occurs (the “Vesting Events”): i) the Company enters commercial production and is granted a commercial production license from the Republic of Kazakhstan; or ii) the occurrence of an Extraordinary Event. An “Extraordinary Event” is defined in the restricted stock agreement as any consolidation or merger of the Company or any of its subsidiaries with another person, or any acquisition of the Company or any of its subsidiaries by any person or group of persons, acting in concert, equal to thirty percent (30%) or more of the outstanding stock of the Company or any of its subsidiaries, or the sale of all or substantially all of the assets of the Company or any of its subsidiaries. In the event of an Extraordinary Event, the grants shall be deemed full vested one day
F-24
BMB MUNAI, INC.
NOTES TO THE CONSOLIDATED FINANCIAL STATEMENTS
prior to the effective date of the Extraordinary Event. The Board of Directors shall determine conclusively whether or not an Extraordinary Event has occurred and the grantees have agreed to be bound by the determination of the Board of Directors. The grantees have the right to vote the shares, receive dividends and enjoy all other rights of ownership over the entire grant amount from the grant date, except for the right to transfer, assign, pledge, encumber, dispose of or otherwise directly or indirectly profit or share in any profit derived from a transaction in the shares prior to the occurrence of a Vesting Event. Shares will only vest to the grantee if the grantee is employed by the Company at the time a Vesting Event occurs. If a Vesting Event has not occurred at the time a grantee’s employment with the Company ceases, for any reason, the entire grant amount shall be forfeited back to the Company.
As of March 31, 2007, there was $5,111,000 of total unrecognized compensation expense related to non-vested share-based compensation arrangements granted under the Plan. That cost is expected to be recognized over a weighted-average period of 2.25 years.
Stock Options
On June 20, 2006 the Company granted stock options to directors of the Company under the Plan. The total number of options was 200,000. The options are exercisable at a price of $7.00 per share. The options will expire three years from the grant date. All of the options vested immediately upon grant. Compensation expense for options granted is determined based on their fair values at the time of grant, the cost of which in the amount of $545,346 was recognized in the Consolidated Statements of Operations and Consolidated Balance Sheet.
On November 12, 2004, the Company granted stock options to its former corporate secretary for past services rendered. These options grant the employee the right to purchase up to 60,000 shares of the Company’s common stock at an exercise price of $4.00 per share. The options vested immediately and expire five years from the date of grant. In April 2006, options to acquire 7,200 common shares were exercised.
F-25
BMB MUNAI, INC.
NOTES TO THE CONSOLIDATED FINANCIAL STATEMENTS
Stock options outstanding and exercisable as of March 31, 2007, were as follows:
|
|
Number of Shares |
|
Weighted Average Exercise Price |
|
|
|
|
|
|
As of March 31, 2006 |
980,783 |
|
$ 4.97 |
|
|
|
|
|
|
Granted |
200,000 |
|
7.00 |
|
Exercised |
(7,200) |
|
4.00 |
|
Expired |
- |
|
- |
|
|
|
|
|
|
As of March 31, 2007 |
1,173,583 |
|
$ 5.33 |
Additional information regarding outstanding options as of March 31, 2007, was as follows:
|
Options Outstanding |
|
Options Exercisable | ||||||||
|
Range of |
|
Options |
|
Weighted |
|
Weighted |
|
Options |
|
Weighted |
|
|
|
|
|
|
|
|
|
|
|
|
|
$ 4.00 – $ 7.40 |
|
1,173,583 |
|
$ 5.33 |
|
4.15 |
|
1,173,583 |
|
$ 5.33 |
The estimated fair value of the stock options issued were determined using Black-Scholes option pricing model with the following assumptions:
|
|
Year ended March 31, 2007 |
|
Year ended March 31, 2006 |
|
|
|
|
|
|
Risk-free interest rate |
5.19% |
|
4.01% - 4.51% |
|
Expected option life |
2 years |
|
2 – 4 year |
|
Expected volatility in the price of the Company’s common shares |
65% |
|
65% - 74% |
|
Expected dividends |
0% |
|
0% |
|
|
|
|
|
|
Weighted average fair value of options and warrants granted |
|
|
|
|
during the period |
$2.73 |
|
$2.01 - $3.92 |
Warrants
On April 12, 2005, the Company granted warrants to placement agents in connection with funds raised on the Company’s behalf. These warrants granted the placement agents the right to purchase up to 110,100 shares of the Company’s common stock at an exercise price of $5.00 per share. These warrants have been offset to the proceeds as a cost of capital. In October 2005, warrants to purchase 60,000 shares were exercised. In April 2006, the remaining warrants to purchase 50,100 shares were exercised.
F-26
BMB MUNAI, INC.
NOTES TO THE CONSOLIDATED FINANCIAL STATEMENTS
On December 31, 2005, the Company granted warrants to placement agents in connection with funds raised on the Company’s behalf. These warrants granted the placement agents the right to purchase up to 916,667 shares of the Company’s common stock at an exercise price of $6.00 per share. These warrants have been offset to the proceeds as a cost of capital. On May 13, 2006, these warrants were exercised.
Warrants outstanding and exercisable as of March 31, 2007 were as follows:
|
|
Number of Shares |
|
Weighted Average Exercise Price |
|
|
|
|
|
|
As of March 31, 2006 |
1,109,624 |
|
$ 5.63 |
|
|
|
|
|
|
Granted |
- |
|
- |
|
Exercised |
(966,767) |
|
5.95 |
|
Expired |
- |
|
- |
|
|
|
|
|
|
As of March 31, 2007 |
142,857 |
|
$ 3.50 |
Additional information regarding warrants outstanding as of March 31, 2007 is as follows:
|
Warrants Outstanding |
|
Warrants Exercisable | ||||||||
|
Range of |
|
Warrants |
|
Weighted |
|
Weighted |
|
Warrants |
|
Weighted |
|
|
|
|
|
|
|
|
|
|
|
|
|
$ 3.50 |
|
142,857 |
|
$3.50 |
|
5.01 |
|
142,857 |
|
$3.50 |
NOTE 14 - REVENUES
|
|
|
Year ended |
|
Year ended |
|
Year ended |
|
|
|
|
|
|
|
|
|
Export sales |
|
$ 15,785,784 |
|
$ 1,592,315 |
|
$ - |
|
Domestic sales |
|
- |
|
4,364,416 |
|
973,646 |
|
|
|
$ 15,785,784 |
|
$ 5,956,731 |
|
$ 973,646 |
F-27
BMB MUNAI, INC.
NOTES TO THE CONSOLIDATED FINANCIAL STATEMENTS
NOTE 15 - EARNINGS PER SHARE INFORMATION
The calculation of the basic and diluted earnings/loss per share is based on the following data:
|
|
|
Year ended March 31, |
|
Year ended March 31, 2006 |
|
Year ended March 31, 2005 |
||
|
|
|
|
|
|
|
|
||
|
|
Net income / (loss) |
$ 1,039,491 |
|
$(5,344,333) |
|
$(3,286,312) |
||
|
|
|
|
|
|
|
|
||
|
|
Basic weighted-average common shares outstanding |
43,523,907 |
|
34,867,642 |
|
26,948,437 |
||
|
|
|
|
|
|
|
|
||
|
|
Effect of dilutive securities |
|
|
|
|
|
||
|
Warrants |
63,492 |
|
- |
|
- |
|||
|
Stock options |
240,409 |
|
- |
|
- |
|||
|
|
|
|
|
|
|
|
||
|
|
Dilutive weighted average common shares outstanding |
43,827,808 |
|
34,867,642 |
|
26,948,437 |
||
|
|
|
|
|
|
|
|
||
|
|
Basic income / (loss) per common share |
0.02 |
|
(0.15) |
|
(0.12) |
||
|
|
|
|
|
|
|
|
||
|
|
Dilutive income / (loss) per common share |
0.02 |
|
(0.15) |
|
(0.12) |
||
|
|
|
|
|
|
|
|
||
NOTE 16 - RELATED PARTY TRANSACTIONS
The Company leases ground fuel tanks and other oil fuel storage facilities and warehouses from Term Oil LLC. The lease expenses for the years ended March 31, 2007, 2006 and 2005, totaled $203,686, $276,055 and $218,428, respectively. Also the Company had accounts payable to Term Oil LLC in the amount of $29,885 and $76,004 as of March 31, 2007 and 2006, respectively. One of our shareholders is an owner of Term Oil LLC.
The future minimum rental payments required under this operating lease are as follows:
|
March 31, 2008 |
$ 239,076 |
|
March 31, 2009 |
239,076 |
|
March 31, 2010 |
179,307 |
|
Total |
$ 657,459 |
During fiscal 2007, 2006 and 2005 the Company and Subsidiary both maintained bank accounts with Bank CenterCredit. During the fiscal years ended March 31, 2007, 2006 and 2005 expenses for banking services rendered by Bank CenterCredit totaled $36,167, $47,185 and $19,777 respectively. One of our shareholders is a Chairman of the Board of Directors of Bank CenterCredit.
F-28
BMB MUNAI, INC.
NOTES TO THE CONSOLIDATED FINANCIAL STATEMENTS
NOTE 17 - COMMITMENTS AND CONTINGENCIES
Historical investments by the Government of the Republic of Kazakhstan
The Government of the Republic of Kazakhstan made historical investments in the ADE Block in total amount of $5,994,200 in relation to ADE Block and $5,350,680 in relation to the Extended Territory. When the Company applies for and is granted commercial production rights for the ADE Block and Extended Territory, the Company will be required to begin repaying these historical investments to the Government of the Republic of Kazakhstan. The terms of repayment will be negotiated at the time the Company applies for commercial production rights.
Capital Commitments
Under the terms of its subsurface exploration contract, Emir Oil LLP is required to spend a total of $48.7 million in exploration and development activities on the ADE Block and the Extended Territory. To retain its rights under the contract, the Company must spend a minimum of $12.7 million in 2007, $8.5 million in 2008 and $70 thousand in 2009. The Company must also comply with the terms of the work program associated with the contract, which includes the drilling of at least nine additional new wells by July 9, 2009. The Company received approval to extend the subsurface exploration contract to July 2009. The failure to meet the minimum capital expenditures or to comply with the terms of the work program could result in the loss of the subsurface exploration contract.
Litigation
In December 2003, Brian Savage, Thomas Sinclair and Sokol Holdings, Inc., filed a lawsuit in Florida naming the Company and some of its former officers and directors as defendants. The plaintiffs in the case alleged breach of contract, unjust enrichment, breach of fiduciary duty, conversion and violation of a Florida trade secret statute in connection with a business plan for the development of the Aksaz, Dolinnoe and Emir oil and gas fields owned by Emir Oil LLP. The plaintiffs seek unspecified compensatory and exemplary damages. The parties have mutually agreed to dismiss this lawsuit without prejudice.
In April 2005, Sokol Holdings, Inc., filed a complaint in United States District Court, Southern District of New York alleging that the Company, and others, wrongfully induced Mr. Tolmakov, Director of Emir Oil, to breach a contract under which Mr. Tolmakov had agreed to sell to Sokol 70% of his 90% interest in Emir Oil LLP. Sokol Holdings, Inc. seeks damages in an unspecified amount exceeding $75,000 to be determined at trial, punitive damages, specific performance in the form of an order compelling BMB to relinquish its interest in Emir and the underlying interest in the ADE fields to Sokol Holdings, Inc. and such other relief as the court finds just and reasonable.
F-29
BMB MUNAI, INC.
NOTES TO THE CONSOLIDATED FINANCIAL STATEMENTS
In October 2005, Sokol Holdings amended its complaint in New York to add Brian Savage and Thomas Sinclair as plaintiffs and adding Credifinance Capital, Inc., and Credifinance Securities, Ltd., (collectively “Credifinance”) as defendants in the matter. The amended complaint alleges tortious interference with contract, specific performance, breach of contract, unjust enrichment, breach of fiduciary duty, conversion, misappropriation of trade secrets, tortuous interference with fiduciary duty and aiding and abetting breach of fiduciary duty in connection with a business plan for the development of the Aksaz, Dolinnoe and Emir oil and gas fields owned by Emir Oil, LLP. The plaintiffs seek damages in an amount to be determined at trial, punitive damages, specific performance and such other relief as the Court finds just and reasonable.
The Company is confident that the matters shall be resolved in the Company’s favor. The Company has retained legal counsel to protect its interests. In the opinion of the Company’s management and legal counsel, the resolution of those lawsuits will not have a material adverse effect on Company’s financial condition, results of operations or cash flows.
NOTE 18 - FINANCIAL INSTRUMENTS
As of March 31, 2007 and 2006 cash and cash equivalents included deposits in Kazakhstan banks in the amount $4,181,698 and $3,881,255, respectively and deposits in U.S. banks in the amount of $7,991,242 and $14,164,868, respectively. As of March 31, 2007 and 2006 cash and cash equivalents also included the marketable securities of $0 and $33,095,609, respectively, consisted of discount bonds issued by General Electric Corporation and discount notes issued by Fannie Mae. Kazakhstan banks are not covered by FDIC insurance, nor does the Republic of Kazakhstan have an insurance program similar to FDIC. Therefore, the full amount of our deposits in Kazakhstan banks was uninsured as of March 31, 2007 and 2006. Our deposits in the U.S. banks are also in non-FDIC insured accounts which means they too are not insured to the $100,000 FDIC insurance limit. To mitigate this risk, we have placed all of our U.S. deposits in a money market account that invests in U.S. government backed securities. As of March 31, 2007 and 2006 the Company made advance payments to Kazakhstan companies and government bodies in the amount $7,115,297 and $2,473,985, respectively. As of March 31, 2007 and 2006 restricted cash reflected in the long-term assets consisted of $303,697 and $156,454, respectively, deposited in a Kazakhstan bank and restricted to meet possible environmental obligations according to the regulations of Kazakhstan. Furthermore, the primary asset of the Company is Emir Oil LLP; an entity formed under the laws of the Republic Kazakhstan.
NOTE 19 - QUARTERLY FINANCIAL DATA (unaudited)
Quarterly financial information is presented in the following summary:
F-30
BMB MUNAI, INC.
NOTES TO THE CONSOLIDATED FINANCIAL STATEMENTS
|
|
Year ended March 31, 2007 |
||||||
|
|
June 30, 2006 |
|
September 30, 2006 |
|
December 31, 2006 |
|
March 31, 2007 |
|
|
|
|
|
|
|
|
|
|
Revenues |
$ 2,345,972 |
|
$ 4,016,972 |
|
$ 2,214,382 |
|
$ 7,208,458 |
|
Income/(loss) from operations |
(3,751,840) |
|
992,732 |
|
(275,654) |
|
3,439,605 |
|
Net income/(loss) |
(3,140,761) |
|
1,016,352 |
|
(90,861) |
|
3,254,761 |
|
Basic net income/(loss) per share |
(0.08) |
|
0.02 |
|
0.00 |
|
0.07 |
|
Diluted net income per share |
$ (0.08) |
|
$ 0.02 |
|
$ 0.00 |
|
$ 0.07 |
|
|
Year ended March 31, 2006 |
||||||
|
|
June 30, 2005 |
|
September 30, 2005 |
|
December 31, 2005 |
|
March 31, 2006 |
|
|
|
|
|
|
|
|
|
|
Revenues |
$ 662,637 |
|
$ 1,385,336 |
|
$ 2,058,792 |
|
$ 1,849,966 |
|
Income/(loss) from operations |
(639,090) |
|
(4,029,892) |
|
(167,650) |
|
(1,112,538) |
|
Net income/(loss) |
(697,651) |
|
(3,885,457) |
|
(52,942) |
|
(708,283) |
|
Basic net income/(loss) per share |
(0.02) |
|
(0.12) |
|
0.00 |
|
(0.02) |
|
Diluted net income per share |
$ (0.02) |
|
$ (0.12) |
|
$ 0.00 |
|
$ (0.02) |
|
|
Year ended March 31, 2005 |
||||||
|
|
June 30, 2004 |
|
September 30, 2004 |
|
December 31, 2004 |
|
March 31, 2005 |
|
|
|
|
|
|
|
|
|
|
Revenues |
$ 118,949 |
|
$ 173,038 |
|
$ 55,904 |
|
$ 625,755 |
|
Income/(loss) from operations |
(473,884) |
|
(740,844) |
|
(1,288,996) |
|
(1,285,810) |
|
Net income/(loss) |
(602,206) |
|
(607,527) |
|
(844,413) |
|
(1,232,166) |
|
Basic net income/(loss) per share |
(0.03) |
|
(0.02) |
|
(0.03) |
|
(0.04) |
|
Diluted net income per share |
$ (0.03) |
|
$ (0.02) |
|
$ (0.03) |
|
$ (0.04) |
NOTE 20 - SIGNIFICANT FOURTH QUARTER ADJUSTMENTS
There were no material fourth quarter adjustments or accounting changes.
F-31
BMB MUNAI, INC.
NOTES TO THE CONSOLIDATED FINANCIAL STATEMENTS
NOTE 21 - SUPPLEMENTARY FINANCIAL INFORMATION ON OIL AND NATURAL GAS EXPLORATION DEVELOPMENT AND PRODUCTION ACTIVITIES (unaudited)
This footnote provides unaudited information required by SFAS No. 69, “Disclosures about Oil and Natural Gas Producing Activities.” The Company’s oil and natural gas properties are located in the Republic of Kazakhstan, which constitutes one cost center.
Capitalized Costs - Capitalized costs and accumulated depletion, depreciation and amortization relating to our oil and natural gas producing activities, all of which are conducted in the Republic of Kazakhstan, are summarized below:
|
|
March 31, 2007 |
|
March 31, 2006 |
|
|
|
|
|
|
Developed oil and natural gas properties |
$ 82,311,230 |
|
$ 68,079,938 |
|
Unevaluated oil and natural gas properties |
25,279,813 |
|
- |
|
Accumulated depletion, depreciation and |
(3,403,475) |
|
(1,396,641) |
|
Net capitalized cost |
$ 104,187,568 |
|
$ 66,683,297 |
Costs Incurred - Costs incurred in oil and natural gas property acquisition, exploration and development activities are summarized below:
|
|
|
For the year ended March 31, 2007 |
|
For the year ended March 31, 2006 |
|
For the year ended March 31, 2005 |
|
|
|
|
|
|
|
|
|
Acquisition costs: |
|
|
|
|
|
|
|
Unproved properties |
|
$ - |
|
$ - |
|
$ - |
|
Proved properties |
|
- |
|
- |
|
19,075,000 |
|
Exploration costs |
|
1,370,797 |
|
3,453,603 |
|
713,220 |
|
Development costs |
|
37,063,321 |
|
14,368,323 |
|
16,687,432 |
|
Subtotal |
|
38,434,118 |
|
17,821,926 |
|
36,475,652 |
|
Asset retirement costs |
|
1,076,987 |
|
856,302 |
|
60,973 |
|
Total costs incurred |
|
$ 39,511,105 |
|
$ 18,678,228 |
|
$ 36,536,625 |
Results of Operations – Results of operations for the Company’s oil and natural gas producing activities are summarized below:
F-32
BMB MUNAI, INC.
NOTES TO THE CONSOLIDATED FINANCIAL STATEMENTS
|
|
|
For the year ended March 31, 2007 |
|
For the year ended March 31, 2006 |
|
For the year ended March 31, 2005 |
|
|
|
|
|
|
|
|
|
Oil and natural gas revenues |
|
$ 15,785,784 |
|
$ 5,956,731 |
|
$ 973,646 |
|
|
|
|
|
|
|
|
|
Operating expenses: |
|
|
|
|
|
|
|
Oil and natural gas operating expenses and ad valorem taxes |
|
2,272,251 |
|
875,319 |
|
406,361 |
|
Accretion expense |
|
173,519 |
|
5,602 |
|
- |
|
Depletion expense |
|
2,006,834 |
|
1,167,235 |
|
229,406 |
|
Results of operations from oil and gas producing activities |
|
$ 11,333,180 |
|
$ 3,908,575 |
|
$ 337,879 |
Reserves – Proved reserves are estimated quantities of oil and natural gas, which geological and engineering data demonstrate with reasonable certainty to be, recoverable in future years from known reservoirs under existing economic and operating conditions. Proved developed reserves are proved reserves that can reasonably be expected to be recovered through existing wells with existing equipment and operating methods. Proved oil and natural gas reserve quantities and the related discounted future net cash flows before income taxes (see Standardized Measure) for the periods presented are based on estimates prepared by Chapman Petroleum Engineering Ltd., independent petroleum engineers. Such estimates have been prepared in accordance with guidelines established by the SEC.
The Company’s net ownership in estimated quantities of proved oil reserves, and changes in net proved reserves, all of which are located in the Republic of Kazakhstan, are summarized below:
|
|
|
Oil, Condensate and Natural Gas Liquids (MBbls) |
||||
|
|
|
For the year ended
March 31, |
|
For the year ended
March 31, |
|
For the year ended March 31, 2005 |
|
Proved developed and undeveloped reserves |
|
|
|
|
|
|
|
Beginning of the year |
|
13,748,000 |
|
13,160,000 |
|
- |
|
Revisions of previous estimates |
|
(916,007) |
|
830,522 |
|
- |
|
Purchase of oil and gas properties |
|
- |
|
- |
|
- |
|
Extensions and discoveries(1) |
|
2,770,000 |
|
- |
|
13,228,755 |
|
Sales of properties |
|
- |
|
- |
|
- |
|
Production |
|
(321,993) |
|
(242,522) |
|
(68,755) |
|
|
|
|
|
|
|
|
|
End of year |
|
15,280,000 |
|
13,748,000 |
|
13,160,000 |
|
Proved developed reserves at year end |
|
11,852,000 |
|
11,168,000 |
|
10,580,000 |
F-33
BMB MUNAI, INC.
NOTES TO THE CONSOLIDATED FINANCIAL STATEMENTS
|
|
(1) |
During the year ended March 31, 2007 we drilled one well (gross and net) on the Kariman structure. The addition of the Kariman structure during the year ended March 31, 2007 resulted in an increase in our estimated proved developed reserves of approximately 2.7 million BOE (barrels of oil equivalent) and no increase in our proved undeveloped reserves. These were the only extensions or discoveries made during the year ended March 31, 2007. |
Standardized Measure – The Standardized Measure of Discounted Future Net Cash Flows relating to the Company’s ownership interests in proved oil reserves for the year ended March 31, 2007, 2006 and 2005 is shown below:
|
|
|
For the year ended March 31, 2007 |
|
For the year ended March 31, 2006 |
|
For the year ended March 31, 2005 |
|
|
|
|
|
|
|
|
|
Future cash inflows |
|
$ 573,808,000 |
|
$ 493,223,000 |
|
$ 274,607,000 |
|
Future oil and natural gas operating expenses |
|
72,650,000 |
|
52,092,000 |
|
46,442,000 |
|
Future development costs |
|
18,200,000 |
|
6,800,000 |
|
7,750,000 |
|
Future income tax expense |
|
166,470,000 |
|
199,113,000 |
|
134,848,000 |
|
Future net cash flows |
|
316,488,000 |
|
235,218,000 |
|
85,567,000 |
|
10% discount factor |
|
145,223,000 |
|
132,573,000 |
|
58,046,000 |
|
Standardized measure of discounted future net cash flows |
|
$ 171,265,000 |
|
$ 102,645,000 |
|
$ 27,521,000 |
Our standardized measure of discounted future net cash flows relating to proved oil reserves was prepared in accordance with the provisions of SFAS 69. Future cash inflows are computed by applying year end prices of oil and natural gas to year end quantities of proved oil and natural gas reserves. Future oil and natural gas production and development costs are computed by estimating the expenditures to be incurred in producing and developing the proved oil and natural gas reserves at year end, based on year end costs and assuming continuation of existing economic condition.
Future income tax expenses are calculated by applying appropriate year end tax rates to future pre-tax net cash flows relating to proved oil and natural gas reserves, less the tax basis of properties involved. Future income tax expenses give effect to permanent differences, tax credits and loss carryforwards relating to the proved oil and natural gas reserves. Future net cash flows are discounted at a rate of 10% annually to derive the standardized measure of discounted future net cash flows. The Standardized Measure of Discounted Future Net Cash Flows is not intended to represent the replacement cost or fair market value of the Company’s oil and natural gas properties.
Changes in Standardized Measure – Changes in Standardized Measure of Discounted Future Net Cash Flows relating to proved oil reserves are summarized below:
|
|
|
For the year ended March 31, 2007 |
|
For the year March 31, 2006 |
|
For the year ended March 31, 2005 |
|
|
|
|
|
|
|
|
|
Changes due to current year operations: |
|
|
|
|
|
|
|
Sales of oil and natural gas, net of oil and natural gas operating expenses |
|
$ (13,513,533) |
|
$ (5,127,217) |
|
$ (569,020) |
|
Sales of oil and natural gas properties |
|
- |
|
- |
|
- |
|
Purchase of oil and gas properties |
|
- |
|
- |
|
- |
|
Extensions and discoveries(1) |
|
75,090,000 |
|
- |
|
77,847,020 |
|
Net change in sales and transfer prices, net of production costs |
|
(5,992,120) |
|
67,650,993 |
|
- |
|
Changes due to revisions of standardized variables |
|
- |
|
- |
|
- |
|
Prices and operating expenses |
|
- |
|
- |
|
- |
|
Revisions to previous quantity estimates |
|
(11,949,945) |
|
9,199,160 |
|
- |
|
Estimated future development costs |
|
(5,419,716) |
|
409,194 |
|
- |
|
Income taxes |
|
5,206,000 |
|
(34,678,000) |
|
(49,757,000) |
|
Accretion of discount |
|
10,264,500 |
|
2,752,100 |
|
- |
|
Production rates (timing) |
|
2,268,615 |
|
25,929,078 |
|
- |
|
Other |
|
12,666,199 |
|
8,988,692 |
|
- |
|
Net Change |
|
68,620,000 |
|
75,124,000 |
|
27,521,000 |
|
Beginning of year |
|
102,645,000 |
|
27,521,000 |
|
- |
|
End of year |
|
$ 171,265,000 |
|
$ 102,645,000 |
|
$ 27,521,000 |
|
|
(1) |
The addition of the Kariman structure during the year ended March 31, 2007 resulted in an increase in our estimated proved reserves pre-tax PV-10 of approximately $75 million (present value of future net revenues before income taxes discounted at 10%). |
Sales of oil and natural gas, net of oil and natural gas operating expenses are based on historical pre-tax results. Sales of oil and natural gas properties, extensions and discoveries, purchases of minerals in place and the changes due to revisions in standardized variables are reported on a pre-tax discounted basis, while the accretion of discount is presented on an after tax basis.
F-34